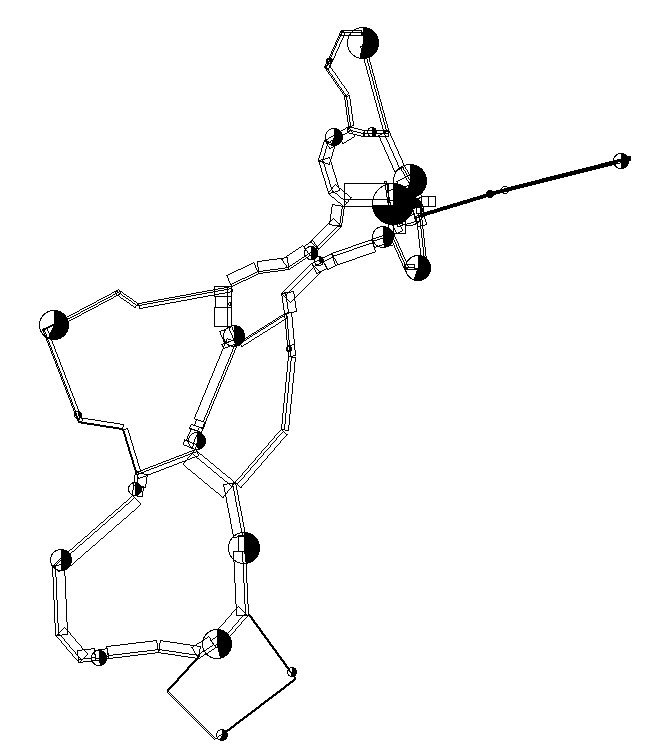
Figure 1: Tentative PRT Network for Fornebu (Oslo, Norway) with Passengers To/From Stations (circles) and Vehicle Flows/Empty Flows. The total width of the network segments represents total vehicle flows, including empties. The thinner segments within the bands represents the part of the total flow that consists only of empty vehicles. The maximum flow of vehicles is 1,254 vehicles/hour

Last modified: February 17, 2003