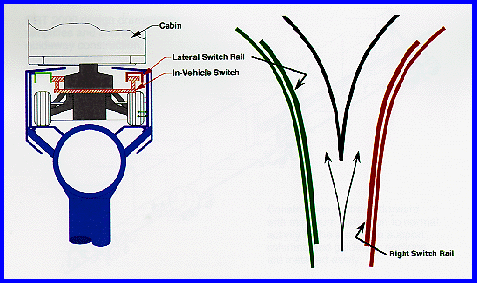
PRT 2000 vehicle utilizes a simple and efficient switching mechanism.

PRT 2000 vehicle utilizes a simple and efficient switching mechanism.
For layout of a PRT network, human comfort criteria impose limitation on: 1) the length of off-line guideways, 2) the minimum superelevated-curve radius, and 3) the minimum distance between guideway branch points. These considerations illustrate the ways in which the selection of line speed enters the planner's thinking.
The system may be placed underground, at grade, or above ground, in which case a clearance requirement of 5m is the standard bridge clearance in the United States. After consideration of these choices most planners choose to elevate the system. PRT 2000 particularly lends itself to elevation because of the small cross section and the use of covers that can be textured and colored to suit the cityscape through which it passes. The system is designed for post spacing in the range from 27 to 37m. This distance can be varied by small amounts to avoid underground utilities, or by larger amounts to span freeways, rivers, etc. The fully loaded guideway is small enough to be easily supported from the sides of buildings or run through buildings. In a downtown area, we envision that the station will typically be integrated into buildings. With a standard propulsion system, grades should be kept to less than or equal to 10 percent.

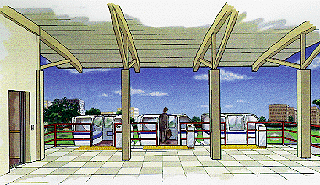
PRT 2000 passenger loading platform.
Once a system is laid out based on these considerations and with knowledge of the travel patterns, it is necessary to perform a detailed, site specific ridership analysis. Standard ridership models are calibrated based on existing transit systems and base the estimate on relative time and cost. Until experience is obtained, there is no solid basis in these models for taking into account the superior service offered by the PRT. Even with these limitations, a PRT study performed in Indianapolis from 1979-1981 produced about 4,000,000 passenger-km per year per lane-km on a network PRT system, ample for profitability with reasonable fares.

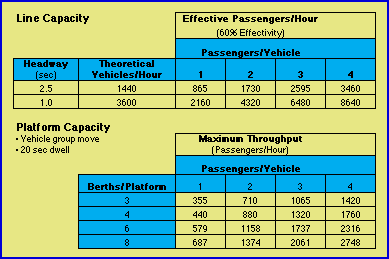
PRT 2000 sample capacity characteristics.
Because of limited ability to predict ridership prior to actual experience, it is best to expand PRT systems cautiously. Having estimated the ridership, the peak-period line and station flows are calculated to determine potential bottlenecks. This should first be done analytically and then simulated on a computer to study short-term fluctuations. A computer program designed to calculate and display line and stations, including a ridership program and a cost program, permits the line and station locations to be varied to optimize the system. This can be done with confidence after the ridership model is calibrated based on PRT 2000 characteristics.