Homework #7 BES 301 Autumn 2005
- For Nov 28 and 30, read Valiela Chs 8-9, and Hatton, pp
59-80. : (skip ch
10 of Valiela)
- For Mon, Dec 5, read Hatton 81-86 and
93-105
- For Wed, Dec 7, read paper by Gould
and paper by Meyer (213-18 and 230-34).
Both papers are on e-reserve..
Take notes in your
class journal. Be prepared to
participate or take the lead in a class discussion on aspects of these
readings.
Research Assignment:
Your final literature review report
(including synthesis paper) (Assignment #4 of the research project) is due before class on Dec 7,
Wednesday. Details of the assignment
can be found in the assignment handout. Note that late submissions will not be
accepted on this final report: no exceptions(see
syllabus)!
Individual Written
Assignment for Mon, Dec 5. (to be worked alone, but with consultation on software,
methodology, etc. Also, feel free to
contact me by e-mail with any question that may arise.)
Prepare these problems and turn in
to E-submit site under assignment “statistics homework” no later than before
class on Dec 5. Work on these alone, but
feel free to get help in using the tools.
Feel welcome to go to the quantitative skills center for
assistance. But, do not treat these as
group assignments. Every student needs
to be able to do these on their own.
Answer the following, preparing a word document for submission to the
e-submit site. When you use Excel, do
not submit the actual spread sheet.
Rather, cut and paste an image of the interesting part of the
spreadsheet display into your word document.
Show work for credit. In the case of the problems to done by hand
or with calculator, show sufficient intermediate results for me to be sure you
understand it and can do it by hand. In
the case of the problems to be done with Excel, show a snapshot of the
spreadsheet to show me that you know how to enter the data and get the
calculation accomplished.
- The following replicated measurements were performed in a laboratory analysis involving titration with a chemical reagent (in mL): 10.08, 10.11, 10.09, 10.10, and 10.12. Calculate the median, mean (average), standard deviation, and CV (coefficient of variance) for this set of measurements. Do this with your calculator and show work.
-
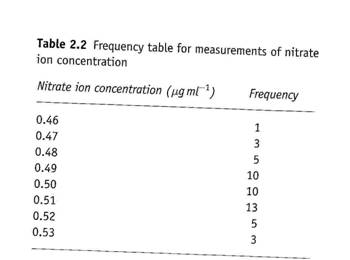
In measuring nitrate concentration in a water sample, the following results and frequencies were obtained:Mean = m=0.500 mg/mL
Std Dev = s = 0.0165 mg/mL
 :
:
Does this distribution appear to be “normal”? Explain how you can tell and what you did to make this determination. If you have work to show, such as a figure, include it in your document.
- Consider
the following two analytical procedures for tin in foodstuffs. The results are reported in mg of tin
per kg of food. These are two
different analytical procedures and meet all of the requirements for
normal distributions, independence, equal variances, etc.
|
Procedure |
Tin found in foodstuff (mg/kg) |
Mean = m |
Std Dev = s |
|||||
|
A |
55 |
57 |
59 |
56 |
56 |
59 |
57.00 |
1.67 |
|
B |
57 |
55 |
58 |
59 |
59 |
59 |
57.83 |
1.60 |
By calculating (using calculator and equations from notes)
determine t, and then with the tables
given out with the notes determine the p-value.
What does this mean? Are the two
means significantly different? What is
the percentage error for your conclusion?
What is the null hypothesis here?
Is it retained or rejected by this comparison?
- Consider
the following data, which are four sets of measurements under different
conditions of the fluorescence of an environmental chemistry sample:
|
Conditions |
Replicate Measurements |
||
|
A |
102 |
100 |
101 |
|
B |
101 |
101 |
104 |
|
C |
97 |
95 |
99 |
|
D |
90 |
92 |
94 |
Using Excel, perform an ANOVA analysis on this data set, and determine whether
or not the four means from these conditions are the same or significantly
different. What is your null
hypothesis? What is the percent chance
that a rejection of this null hypothesis would be in error? Cut
and paste a copy of your spreadsheet display to show your work
- The
following absorbance data was obtained in a test for glucose. The solutions were made up with good
accuracy and precision to the specified concentrations (in mM) and then the absorbance was measured with an
instrument. This is measure of how
much glucose is present.
|
Concentration (mM) |
0 |
2 |
4 |
6 |
8 |
10 |
|
Absorbance (unitless) |
0.002 |
0.150 |
0.294 |
0.434 |
0.570 |
0.704 |
Using Excel (or something similar), generate an (x,y) scatter plot of the
data. Include a trend line (linear
regression) on the graph and give the equation that is the best fit, and the R2
value for this fit. Use cut and paste copy techniques to place the resulting figure with
equation in the document for this assignment.
- Consider the paper by Shortle et al that we have already read.
- In the Results and Discussion section find one instance where they rejected their null hypothesis based on statistics and one where they supported it. In each case state in your own words what the null hypothesis was and what the statistical justification for rejecting or supporting it was. Be sure that I know what they concluded in each case.
- In the
Figure 2 of the Results and Discussion section, several conclusions are
formed about relationships based upon regression statistics. Find a case where the null hypothesis
was supported and one where it was rejected. Explain from the values given how this rejection
of H0 was determined.
Simply look at the numbers in the caption and figures and explain
in two cases what they mean. The parameter “adj
r2” in the figures is the adjusted R2 mentioned in
class this morning; it is almost the same as the ordinary R2
and should be interpreted that way here.