
CONCLUSIONS
In this project, seven bio-acids, pH and ethanol were measured quantitatively in
fermenting coffee samples at three pH ranges corresponding to (1) optimum
fermentation completion (mucilage just liquified) and (2 and 3) two over-fermented ranges
corresponding to approximately 0.33 pH unit and 1.5 hours past
optimum to 0.7 pH unit and 4 hours past optimum, respectively. From the quantified bio-acid and ethanol concentrations
in these ranges the following conclusions can be drawn:
•The bio-acids glacturonic, formic, malic, acetic, citric and propionic are found not to
vary during the conditions of over-fermentation.
•Both lactic acid and ethanol increase in concentration with statistical significance
(one-tailed t test) between ranges 1 and 2 and 1 and 3. Both lactic acid and ethanol concentrations
approximately quadrupled during the period of over-fermentation.
•The use of pH as an indicator of over-fermentaion is justified. The other species, namely, ethanol and
lactic acid, track with pH and have been found to be indicative of over-fermentation.8,9
The findings of this research will lead to a better understanding of the
coffee mucilage fermentation process. This knowledge can then be
applied to generate coffee improvement methods beneficial to family
coffee farms. Results from this and
future research may lead to new, inexpensive techniques that can be utilized
and applied by impoverished coffee farmers in Nicaragua and other poverty-stricken countries
impacted by the coffee crisis.

HPLC and test strip
analysis of bio-acids produced in fermented coffee mucilage on
small farms in Nicaragua
Jackels, S.*, Edquist, B.*, Pham, T.*, Jackels, C.**,
Rivas, R.***, and Vallejos, C.***
*Seattle University, Seattle WA, **University of
Washington Bothell, Bothell WA, ***University of Central America Managua,
Managua NI

RESULTS
Acids determined by HPLC in
fermenting coffee samples:
Table 1. Order of elution of organic acids.
Since lactic and
ascorbic acids eluted in the same peak, these acids were
determined by the Reflectoquant test strip method. Ethanol was determined by Reflectoquant test
strip.
Prior to initiation
of fermentation, the following concentrations were found in freshly depulped
coffee muclilage.
Table 2. Initial Concentrations
prior to fermentation.
As shown in the
Table 3 below, for 25 samples, galacturonic, formic, malic, acetic, citric
and propionic acids were found not to vary during the course of fermentation.7
Table 3. Average concentrations
of non-statistically varying acids.
As shown in Table
4, next column, for 25 samples, average lactic acid and ethanol
concentrations were found to increase during the course of fermentation
from range 1 to range 3.
Table 4. (See next column, above) Average concentrations and changes of lactic acid and ethanol
(mg/L) during pH ranges of fermentation. aReported as: mean (standard deviation, number of batches); bReported as: change in mean (one-tailed p-value from
t-test).

ABSTRACT
Small-holder coffee farmers in developing countries like
Nicaragua are seeking reliable
methods to produce better coffee and the information and tools needed to enter specialty coffee markets like Fair Trade and
Organic. The goal of this research is to understand the changes taking place
during a critical step in coffee
production on the farm: the fermentation step that uses a natural process to break down coffee mucilage fruit that clings to the
coffee beans. This paper reports the results of a field study conducted during
the 2005-06 Nicaraguan coffee
harvest in order to investigate the relationship between scientific control of the coffee fermentation process and the quality of
the resulting roasted coffee. First, small-scale, well-controlled
laboratory fermentation was carried out
on twelve different daily batches of coffee at the farm La Canavalia in Matagalpa, Nicaragua.
With otherwise identical treatment, fermentation of the small samples was halted by washing when the pH of the
fermenting mass decreased from
a starting pH of 5.8 to approximately 4.6, 4.3, or 3.9. Samples of coffee with mucilage were reserved and frozen for
laboratory analysis. Bio-acids were separated and quantified by HPLC (for formic,
proprionic, citric, malic, acetic,
and glacturonic) or Merck Reflectoquant test strips (for ascorbic and lactic). Results of this study, including
correlation between the final fermentation
pH and bio-acid profiles, will be presented.
This project was supported
by a NSF Discovery Corps Senior Fellowship (CHE-0512867).
INTRODUCTION
With coffee prices
reaching the lowest inflation-adjusted prices in 100 years in
2001, the impact remains considerable among the poverty-stricken
coffee producers in developing countries.1 Nicaragua, the second poorest country in the
Western
hemisphere, has lost roughly 122,000 jobs to the crisis and has experienced
a notable impact on family farms.2 One solution to the crisis is to aid family
farms with development programs.
Cooperative groups of farmers are working toward organic and
fair-trade certifications and are using inexpensive methods to farm and produce
better coffee for specialty markets in developed countries.
Though there are several
steps in the processing of coffee, the fermentation step (step 6, Fig. 1) is the step of focus for this research. Over-fermentation and under-fermentation of coffee mucilage alters the
beverage’s quality by creating an unpleasant taste and smell.3 Currently, most
Nicaraguan coffee producers determine the completion time for fermentation of coffee
mucilage manually. This is problematic since the
fermenting mucilage must be checked on periodically given that the amount of time
needed to ferment has many variables and is different each day.
Previously, our
research has connected pH of coffee mucilage to stages of fermentation. 4 The pH of coffee mucilage at different
points of fermentation (under, over and optimal fermentation) was
measured and lead to the findings that coffee is optimally fermented around a
pH of 4.6 and as coffee mucilage becomes more fermented, the pH decreases.

METHODS
During the harvest
of December 2005, small-scale, well-controlled fermentation was carried out on
eleven daily batches of coffee processed on the farm La Canavalia in Matagalpa, Nicaragua. Each field experiment consisted of six buckets derived from a
common batch of coffee. The fermentation was
terminated and samples were collected at the time of washing which
was controlled such that the pH was in the range 4.5 – 4.8 (range 1), 4.1 –
4.4 (range 2), or 3.6 – 4.0 (range 3).
Fermentation was “complete,” meaning that the mucilage was
liquified, in range 1 so that ranges 2 and 3 were over-fermented
by 1.5 to 4 hours. Samples were collected and frozen after
being field analyzed for pH, glucose, lactic acid and ethanol.
Subsequently, in
the Seattle University laboratory, coffee mucilage samples were
prepared by thawing sample coffee beans with attached mucilage. 30 g of coffee sample were mixed with 50 mL of
purified water. The mixture was stirred for forty-five
minutes with the magnetic stir bar and 4.5mL aliquots of the
solution were taken and centrifuged (5 min at 10,000 g). The supernatant was filtered twice through 0.45 μm
micrometer filters. Finally, 1400
μl of the resulting liquid was then placed in a vial containing a 200 μL of
pyrazinecarboxylic acid standard solution (0.05mg/mL) for analysis
by HPLC (Agilent 1100 series instrument). The mobile phase was 0.5 %
aqueous ammonium phosphate at pH 2.8. The flow rate was 0.8 mL/min.with an Alltech
Prevail column (5 μm particle size, 4.6 mm x 150 mm size) and detection in the ultraviolet (Spectraphysics Model
8450) at 260 nm.

REFERENCES
1 Oxfam International. 2003. Mugged: Poverty in your Coffee
Cup. Oxford, U.K.: Oxfam Publishing Nov. 2003.
58P.
2 International Coffee Organization. 2003. Impact of the coffee crisis on poverty in producing countries. London:
International Coffee Organization.
International Coffee Council document 89-5. 10 p. Available: http://www.ico.org/documents/icc89-5r1e.pdf.
3 Lopez, C.I.; Bautista, E.; Moreno, E.; Dentan, E. ASIC 1989, 13, 373-384.
4 Jackels, S.; Jackels, C. J. of Food Science. 2005, 70, 321-325.
5 Jackels, C.; Jackels, S.; Kleven, S.; Fraser-Dauphinne, S.;
Vallejos, C. Proceedings of the 21st ASIC meeting. 2006, 434-443.
7 Rivas, R. Undergraduate Research Thesis, University of
Central America Managua, 2006.
8 Avallone, S.; Guiraud, J.P.; Guyot, B.; Olguin, E.;
Brillouet, J.M. J. of Agricultural and Food Chemistry. 2001, 49, 5556-5559.
9 Avallone, S.; Brillouet, J.M.; Guyot, B.; Olguin, E.;
Guiraud, J.P. International J. of
Food Science and Technology 2002, 37, 191-198.
Background Image from Flickr:
http://flickr.com/photos/tonx/145685020/

RESEARCH QUESTION
What is the
relationship between the pH and the concentration of bio-acids in coffee mucilage
sampled at different stages of fermentation? Hpothesis: lactic acid is responsible for the drop
in pH at the time of completion.
5. Pulped coffee emerging
from the cherry pulping machine
6. Pulped coffee in a cement tank with a drain
(no water added) for natural fermentation
7. Washing the mucilage
from the fermented coffee
8. Drying and sorting
defective coffee beans
9. Final drying stage,
under the sun
10. Coffee stored in warehouse until sold
Figure 1. Steps in coffee process on the farm Nicaragua.
1. Harvesting of ripe coffee cherries
2. Sorting picked cherries to remove unripe cherries
3. Coffee cherries washed and selected by density
4. Coffee cherries mechanically pulped in the wet mill building
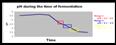
Optimal fermentation is the point when the mucilage is liquifed so that it can be
washed off the beans. Previous field research5 established the variation of pH during the
coffee fermentation period as shown in Fig. 2.
These studies established that the coffee mucilage became liquified in pH range 1
(4.5 – 4.8) and in ranges 2 and 3 the coffee was over-fermented
resulting in a decrease in coffee quality observed in the resulting roasted
coffee in the cup.5
The goal of the present research is to understand the changes taking place during the
natural fermentation step in coffee processing.
Toward this end, we used HPLC and enzyme- based test strips to
measure bio-acid concentrations in controlled experiments on fermenting
coffee.

The HPLC data were collected with the Peak SimpleTM system and were quantified
by peak integration in comparison with calibration curves of the
pure acids. Statistical analysis of
the results was carried out with Excel.
These solutions were also tested for lactic and ascorbic acid concentrations and pH
using the reflectoquant system.6
Figure 2. Curve showing the
variation of pH during coffee fermentation.


ACKNOWLEDGEMENTS
This project was supported by a NSF Discovery Corps Senior
Fellowship (CHE-0512867). Edquist and
Pham acknowledge summer research support through a Merck/AAAS grant. The authors thank Catholic Relief
Services/Nicaragua and the cooperative ADDAC for access to the farm and
use of coffee during processing.


15.1
Standard
(pyrazine carboxylic
acid)
11.4
Propionic
6.1
Citric
4.5
Acetic
3.9
Lactic and
Ascorbic
3.3
Malic
2.7
Formic
2.1
min.
Galacturonic
HPLC elution time
Organic
Acid


10
130
Propionic
30
250
Citric
80
320
Acetic
60
220
Malic
190
340
Formic
320
10,600
Galacturonic
Standard
Deviation
Average
Concentration (mg/L)
Acid

377
(291, 9)
117
(26, 9)
3.88
(.16, 9)
Range
3a
110
(.044)
41
(.009)
-0.33
(.0005)
Change
(1→2)b
266
(.034)
88
(.024)
-0.70
(2.9 x 10⁻⁶)
Change
(1→3)b
221
(129, 11)
70
(31, 11)
4.25
(.14, 11)
Range
2a
111
(45, 5)
29
(17, 5)
4.58
(.18, 5)
Range
1a
Ethanol
Lactic
Acid
pH
Table
4.

515
2,150
mg/L
Glucose
2.9
4.9
mg/L
Lactic
Acid
8.0
16.6
mg/L
Ethanol
0.18
5.92
pH
Std. Dev.
Average
Concentration