1) MT calibration patches for 7 equatorial zones appear good,
   i.e. they are readable and no overally suspicious features
   in the data are present. It seems that we could use these
   data to get photometric calibration accurate to within a
   couple of percent. This might not be true for z filter
   where the good stars do not go deep enough. Here 'good'
   stars are those with magnitudes determined better than
   0.05-0.1 mag, AND fainter than 14 mag (brighter stars
   saturate chips on the main camera). In z filter the
   magnitude error becomes >~ 0.1 already for m ~ 15. It is
   not clear what causes so large errors for so bright objects.
   One possibility is that the aperture size is too large. It
   would be great if MT pipeline could be run again with a
   smaller aperture size, at least for some subset of the data.
   A good choice would be zone K since it has many stars observed
   twice, and thus we can independently estimate errors.


2) Errors do not behave as one would expect. As mentioned above,
   many stars in zone K were observed twice and these data can
   be used as an independent check of the photometric errors
   quoted by MT pipeline. That is, one can compare the magnitude
   differences between the two measurements to the quoted errors.
   We would expect that these differences, when normalized by the
   quoted errors, show a Gaussian distribution with sigma = 1.41
   (instead of 1 because we take the difference of 2 measurements).
   In r, i, and z bands they do indeed show a Gaussian distribution,
   but the width is about a factor of 2 larger. In other words,
   the quoted errors seem to be underestimated for about a factor
   of 2. In u and g bands the distribution is clearly non-Gaussian
   and resembles a top-hat distribution between -4 and 4, and there
   are some outliers with values as high as 100. The outliers are
   not too important because they are easy to recognize, but the
   strong non-Gaussianity of the error distribution is worrisome.
   We do not understand what is going on. It might be a good idea
   to observe zone K again, at least in u, r and z bands, and to
   try to go deep enough in filter z.
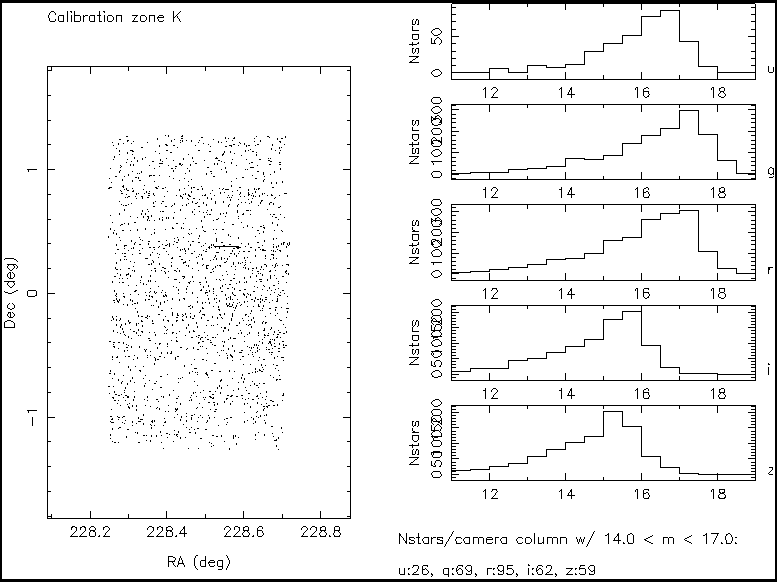
The following 3 figures show the results of analysis for equatorial calibration zone K.
1) The large panel on the left side displays all detected objects in Dec-RA map. On the right hand side there are 5 histograms with the distribution of sources in each band. Note in the last histogram that the z band data do not go deep enough. Below the histograms there is a printout of the number of good stars in each band. 'Good' stars are those with magErr>0 (reliable magnitudes) and 14.0 < m < 17.0. The numbers are normalized to 1 camera column width.
Click here for PostScript file.

2) This figure shows three color-color diagrams in the first row, 5 magnitude error vs. magnitude diagrams in the second row, and 4 color-magnitude diagrams in the third row. Note in the last panel in the second row that errors in z band are about 0.1 already for z magnitude of ~15.
Click here for PostScript file.

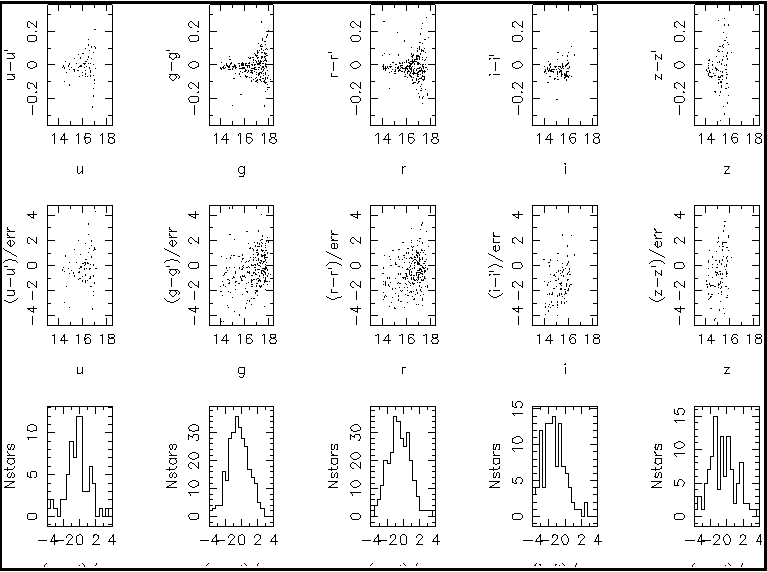
3) This figure shows analysis of quoted errors based on multiple observations of zone K. For stars which were observed twice, the magnitude difference between the two measurements is compared to the quoted error. The first row shows the dependence of the magnitude difference on magnitude. The magnitude difference increases with magnitude as expected because the error also increases with magnitude (see figure 2 above). The second row shows the dependence of the ratio of magnitude difference to error on magnitude. As one would expect, it does not depend on magnitude. However, this ratio should show a Gaussian distribution with sigma = 1.4 which is not the case. This is emphasised in histograms shown in the third row (x axes are (mag-mag')/err for u, g, r, i, and z). In r, i, and z bands the ratio does show a Gaussian distribution, but the width is about a factor of 2 larger than expected. In other words, the quoted errors seem to be underestimated for about a factor of 2. In u and g bands the distribution is clearly non-Gaussian and resembles a top-hat distribution between -4 and 4. This is worrisome...
Click here for PostScript file.

Douglas Tucker has completed new reductions of MT patches, this
time using a 50% smaller 'small aperture':

>The new reductions have been completed, and they reside in the
>following sdssdp2 directories:
>
>Equatorial Patch    Directory
>----------------    ---------
>G, (K)              /data/dp2.5/dp/mt/run/JL0201/mjd50900a
>H, K                /data/dp2.5/dp/mt/run/JL0201/mjd50904a
>I, L                /data/dp2.5/dp/mt/run/JL0204/mjd50906a
>J                   /data/dp2.5/dp/mt/run/JL0204/mjd50907a
>M                   /data/dp2.5/dp/mt/run/JL0208/mjd50926a
>N (partial)         /data/dp2.1/dp/JL0210/mjd50935a
>
>I managed to get mjd50900a through excal and kali in the end, after
>all, so the inter-K-field comparison is possible.  Recall that the
>apertures for these reductions are big aperture=24"-diameter, small
>aperture = 12"-diameter; the previous reductions had big aperture =
>small aperture = 24"-diameter.

I performed the same analysis as before (figures are at the bottom
of this page). Conclusions are:

1) There are no significant differences is magnitude histograms
   compared to the first reductions.

2) Color-color diagrams show smaller spread than before, probably
   showing that there are less outliers.

3) Magnitude error vs. magnitude diagrams had a single well-defined
   dependence for the first set of reductions. Now there are several
   curves for each band, and some of them show errors > 0.1 mag
   irrespective of magnitude. This might point to some weird
   systematics in the reduction, or may simply reflect varying
   observing conditions.

4) Color-magnitude diagrams do not show any difference, except that
   perhaps i-z color has somewhat smaller spread for sources with
   faint i magnitudes.

5) There is a change in the cumulative SNR. It is now smaller in
   u and g, and larger in r, i and z bands. Here is the new table:

     Cumulative SNR for Ka:
   filter   SNR   Nstars
     u      91.8    10
     g     278.7    70
     r     457.5    74
     i     336.0    51
     z     124.5    18

   and for reference here is the old one:
     Cumulative SNR for K:
   filter   SNR   Nstars
     u     255.1    23
     g     545.3    66
     r     417.8    60
     i     268.5    41
     z      71.7     8

6) Comparison of quoted errors and actual differences in magnitudes
   for stars observed twice shows that they agree _much_ better than
   before, notably in u band. Now we get Gaussian distributions in
   all bands, with the widths consistent with the expected value of
   1.4 (the bottom panels in figure 2 below). Note that this improved
   agreement could be caused by either more consistent magnitudes
   between the two measurements, but also by simply increasing the
   quoted errors. Distribution of actual differences (the top panels
   in figure 2 below) shows that they indeed are smaller than before.
   For example, in g band typical differences were already about
   0.05 mag for ~15 mag objects, while now they become ~0.05 mag
   for 16-17 mag objects. I think this shows that using a smaller
   aperture in the data reduction is a good idea.

   A slight peculiarity exists for the data in i band: there is
   a systematic difference of about 0.02-0.03 mag between different
   patches, and it appears to be magnitude independent.


   Given all of the above I would conclude the following:

   1) We need to use a small aperture to reduce the data as
      Douglas did in the latest set of reductions.

   2) We can calibrate with what we have to ~5%.

   3) We might be able to achieve ~2%, but only in g, r and i bands.
      If we want to get the same accuracy in u and z bands, then
      we need to get more (better) data.
Figure 1 Click here for PostScript file.

Figure 2 Click here for PostScript file.
