Globular Cluster Palomar 5 in SDSS data
Position of various stellar populations in SDSS color-color
diagrams can be determined in several ways. For example,
Fukugita et al. (1996) calculated colors by convolving stellar
spectra with SDSS filters, while Krisciunas, Margon and Szkody
(1998) determined colors directly by observing a sample of stars
with known types. Another way to determine colors for stellar
populations is by utilizing color-magnitude diagrams constructed
for globular clusters. Stellar populations can be recognized
from the morphology of data distribution in such diagrams, and
then studied in color-color diagrams.
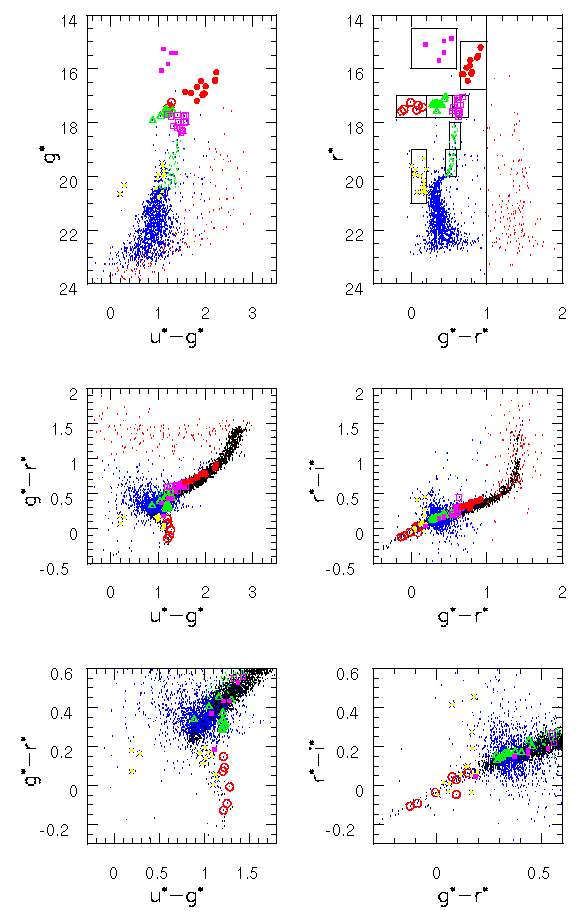
The figure below (click here for
PostScript version) shows color-magnitude and color-color
diagrams for about 2000 stars observed in SDSS commissioning run 756,
which are inside a circle with 5 arcmin radius and centered on the
position of the core of globular cluster Palomar 5 (the data are not
corrected for extinction, estimated to Ar = 0.14 from maps by
Schlegel et al., 1998). The upper two panels show g vs. u-g and
r vs. g-r color-magnitude diagrams. The middle two panels show
g-r vs. u-g and r-i vs. g-r color-magnitude diagrams. These two
diagrams also include about 5000 field stars, marked by black dots,
which clearly outline the stellar locus. The lower two panels show the
zoomed versions of the above two diagrams.
Data are coded according to the position in r vs. g-r color-magnitude
diagram displayed in the upper right corner. Most of sources with
g-r < 1 probably belong to Palomar 5 and are displayed as blue dots
in all 6 diagrams, while stars with g-r > 1, probably field stars, are
displayed as red dots. Some stars with g-r < 1 are further coded according to:
- horizontal branch stars with r ~ 17.5, further separated into
red (open magenta squares), intermediate (solid green triangles) and
blue (open red circles).
- red giants with r~16 (solid red circles).
- post-AGB stars with r~15.5 (solid magenta squares).
- post-main-sequence stars with r~18-20 (green dots).
- blue stragglers with r~20 (blue crosses with yellow centers).
Some noteworthy points are:
- A and F stars of low and high gravities can be separated
photometrically by their u-g color (the lower left panel): blue
stragglers (blue crosses with yellow centers) are bluer in u-g for
up to 0.2 mag than the blue horizontal branch stars (open red circles).
- two blue stragglers selected in r vs. g-r diagram appear to be
low-z QSOs instead, as seen in g vs. u-g diagram (upper left panel).
- red giant stars seem to be offset for 0.1-0.2 mag from the
stellar locus (middle panels).

