Biostatistics: A Methodology for the Health Sciences (2nd Edition)
Gerald van Belle, Lloyd Fisher, Patrick J. Heagerty, Thomas Lumley
| Datasets |
| Errata |
| Code
for examples |
| Featured graph |
| Web appendix by chapter |
| Tables |
| Links |
From time to time we will add a featured graphic, illustrating
some interesting technique or dataset. Here is the first one.
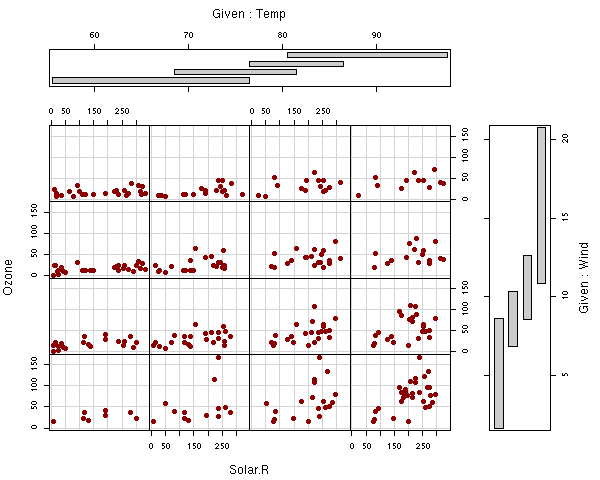
This image is the basis for the cover art. It shows the
relationship
between solar radiation and ozone concentrations (in New York in
summer), stratified to remove
the masking effects of wind and temperature. A simpler version is in
Figure 3.7. The unstratified graph which gives quite a different
impression, is Figure 3.9