Slide 1
LIS 570
Summarising and presenting data - Univariate analysis continued
Bivariate analysis
Slide 2
Selecting analysis and statistical techniques
DeVaus, p. 133

Slide 3
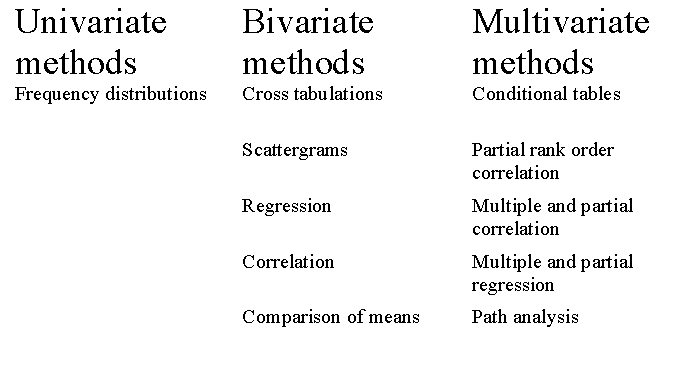
Methods of analysis (De Vaus, 134)
Slide 4
Summary
|
|
Inferential statistics for univariate analysis |
|
|
Bivariate analysis |
crosstabulation
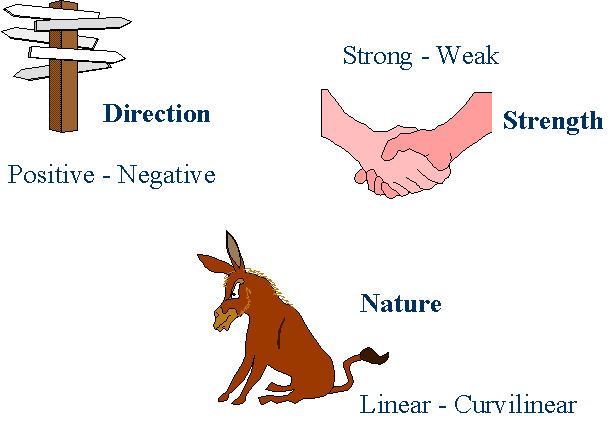
the character of relationships - strength, direction, nature
correlation
Inferential statistics - univariate analysis
Slide 6
Standard Error
Probability theory
for 95% of samples, the population mean will be within + or - two standard error units of the sample mean
this range is called the confidence interval
standard error is a function of sample size
to reduce the confidence interval, increase the sample size
Slide 7
Inference for non-interval variables
Slide 8
Bivariate Analysis
Slide 9
Association
Example: gender and voting
Are gender and party supported associated (related)?
Are gender and party supported independent (unrelated)?
Are women more likely than men
to vote labor?
Are men more likely to vote Liberal?
Slide 10
Association
Assciation in bivariate data means that certain values of one variable tend to occur more often with some values of the second variable than with other variables of that variable (Moore p.242)
Cross Tabulation
Correlation cofficient
Slide 11
Cross Tabulation Tables
Designate the X variable and the Y variable
Place the values of X across the table
Draw a column for each X value
Place the values of Y down the table
Draw a row for each Y value
Insert frequencies into each CELL
Compute totals (MARGINALS) for each column and row
Slide 12
Determining if a Relationship Exists
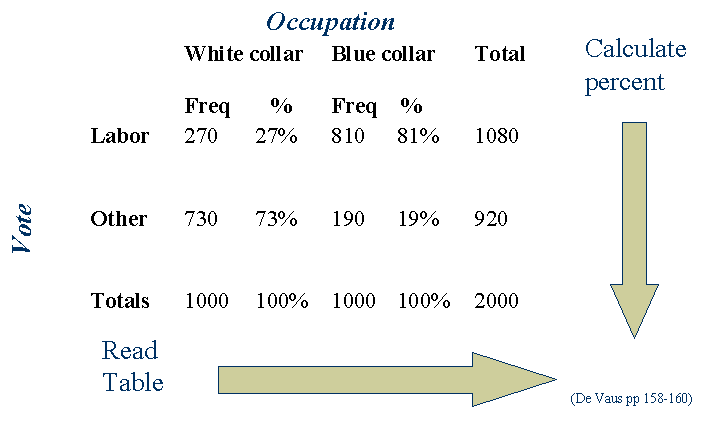
Compute percentages for each value of X (down each column)
Base = marginal for each column
Read the table by comparing values of X for each value of Y
Read table across each row
Terminology
strong/ weak; positive/ negative; linear/ curvilinear
Slide 13
Cross tabulation tables

Slide 14
Cross tabulation
Use column percentages and compare these across the table
Where there is a difference this indicates some association
Slide 15
Describing association
Slide 16
Describing association
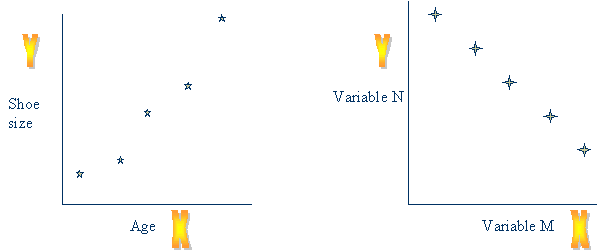
Two variables are positively associated when larger values of one tend to be accompanied by larger values of the other
The variables are negatively associated when larger values of one tend to be accompanied by smaller values of the other
(Moore, p. 254)
Slide 17
Describing association
Scattergram
a graph that can be used to show how two interval level variables are related to one another
Slide 18
Description of Scattergrams
Strength of Relationship
Strong
Moderate
Low
Linearity of Relationship
Linear
Curvilinear
Direction
Positive
Negative
Slide 19
Description of scatterplots

Slide 20
Description of scatterplots

Slide 21
Correlation
Correlation coefficient
|
|
number used to describe the strength and direction of association between variables |
Very strong = .80 through 1
Moderately strong = .60 through .79
Moderate = .50 through .59
Moderately weak = .30 through .49
Very weak to no relationship 0 to .29

Slide 22
Correlation Coefficients
Nominal
Phi (Spss Crosstabs)
Cramerís V (Spss Crosstabs)
Ordinal (linear)
Gamma (Spss Crosstabs)
Nominal and Interval
Eta (Spss Crosstabs)
Slide 23
Correlation: Pearsonís r (SPSS correlate, bivariate)
Interval and/or ratio variables
Pearson product moment coefficient (r)
two interval normally distributed variables
assumes a linear relationship
Can be any number from
0 to -1 : 0 to 1 (+1)
Sign (+ or -) shows direction
Number shows strength
Linearity cannot be determined
from the coefficient
r =
.8913
Slide 24
Summary
Bivariate analysis
crosstabulation
X - columns
Y - rows
calculate percentages for columns
read percentages across the rows to observe association
Correlation and scattergram
describe strength and direction of association