
 Next
Page
Next
Page
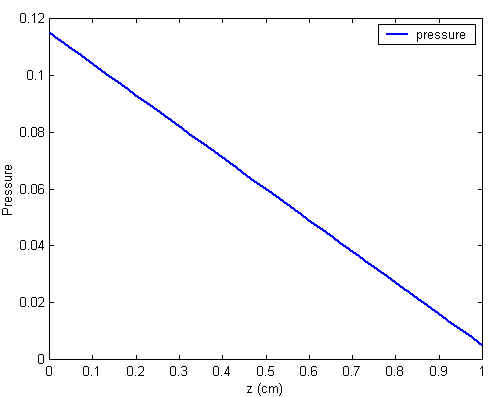
In this model we will be adding a pressure drop across the length of the reactor. When designing this reactor model, we have designed the molar flow rate to be a function of pressure. Therefore, as the pressure changes in the reactor, the molar flow rate of each species will also change. This will affect the amount of desired product produced.
Graph 2.1: Pressure drop across microchannel
This model shows the actual change in pressure through the reactor. It indicates that the pressure changes linearly along the entire length of the channel and from this one can note the pressure at any point within the reaction along with the total amount of pressure that has been lost through the process.
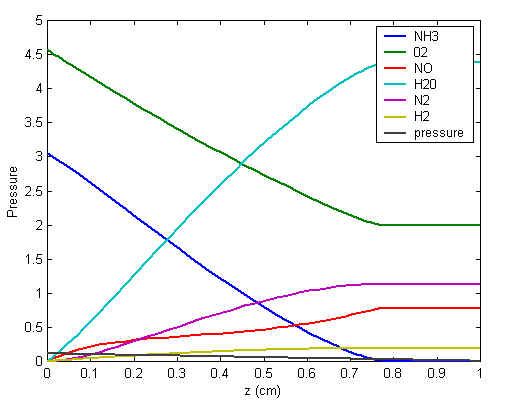
Graph 2.2: Flow rate of species with pressure gradient
This graph clearly shows that there is no
great change in flow rate between the isobaric and non-isobaric
models. We can conclude that the modeling of the pressure within
the system may improve the model, and that the system is much
more sensitive to the change in temperature than it is to the
change in pressure.
Want to find out more? Click
on the Expert Model 2
page.