
 Next Page
Inlet flowrate
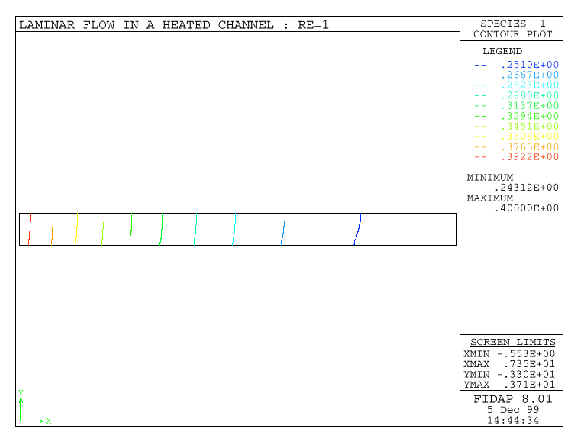
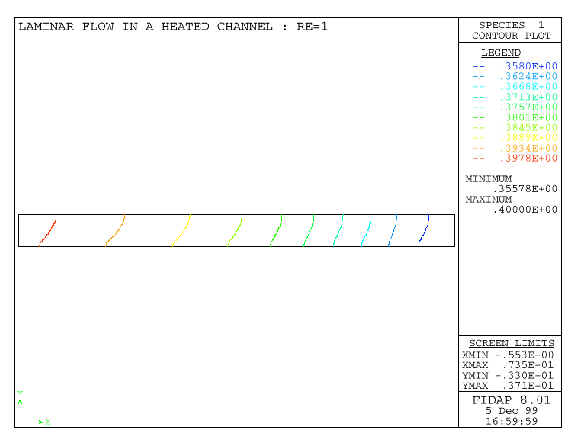
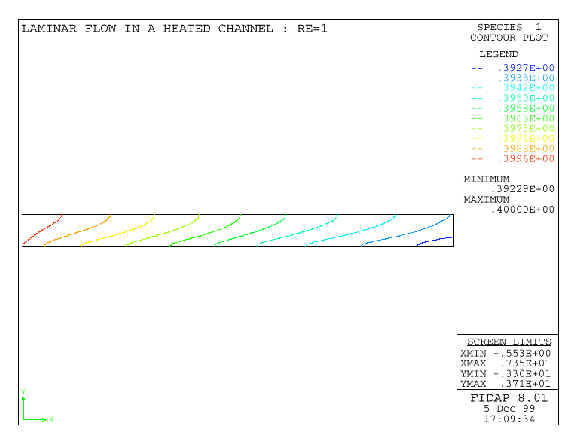
Question: As the input flow rate increases, will the final ammonia concentrations be higher, lower, or no effect?
| Input flow rate | 1 | 10 | 50 |
| Minimum ammonia concentration | 0.24359 | 0.3558 | 0.39229 |
Graph 4.41 Graph 4.42 Graph 4.43
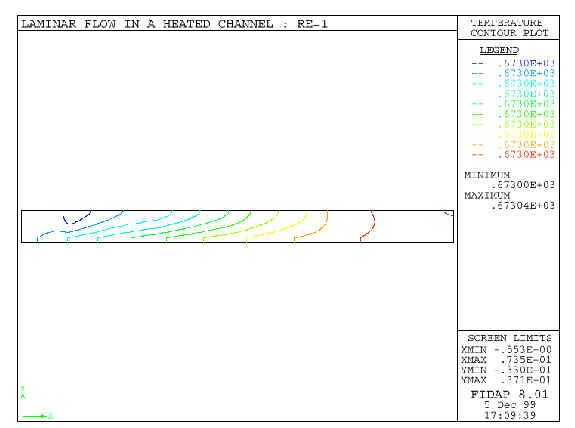
The contour plots above also indicate how increasing the flow rate distorts the concentration profiles along the y-dimension of the channel. This increased non-uniformity is because the fluid in the center of the channel has less and less time to equilibrate with the slower-moving fluid at the walls. Although this effect would be seen if we neglected the parabolic flow profile, by accounting for that flow profile we obtain even more distortion.
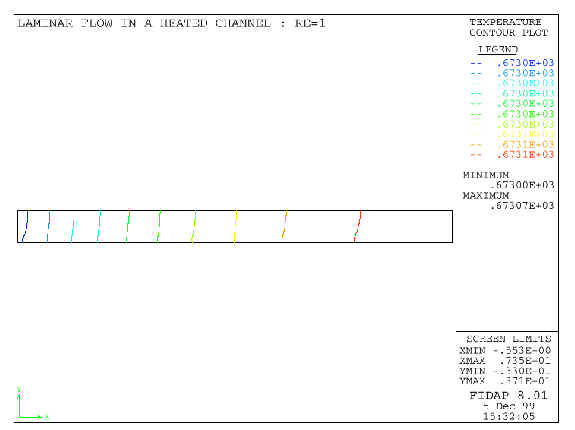
The temperature profiles are also increasingly distorted with increased flow rate, although the maximum temperatures do not change significantly.
Graph 4.44 Graph 4.45 Graph 4.46