Slide 13 of 14
Notes:
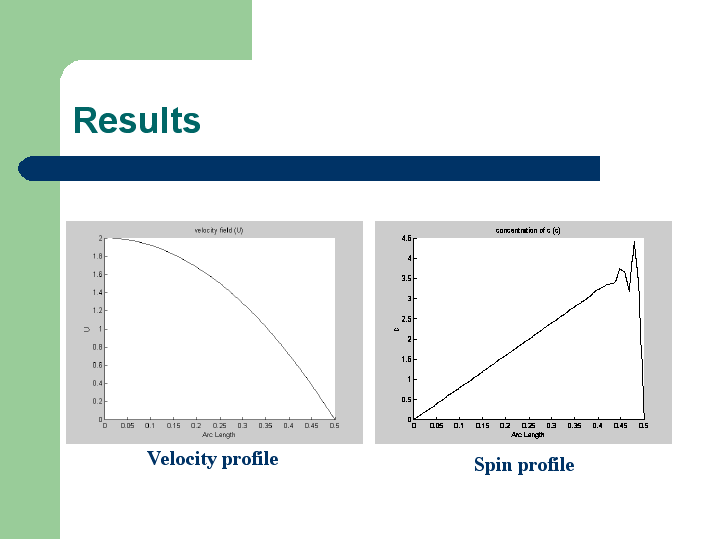
Here again we see results from the same simulation.
The left plot is a velocity profile at the outlet, confirming a fully developed velocity profile
And to the right we see the spin profile with zero boundary conditions at both sides and a relatively linear increase with distance from the centerline


