Last updated:
February 2, 2000
Note: These notes are preliminary and incomplete
and they are not guaranteed to be free of errors. Please let me know if
you find typos or other errors.
Up to now we have covered (1) the labor market and the production
function, where real wages, employment and potential output is determined, and (2) the
market for goods and services, where the real interest rate and investment and saving are
determined. Now we consider the market for financial assets (money and "bonds")
by focusing on the demand and supply of money in the economy. This will give us insights
into other forces on interest rates - particularly those created by the Fed - and also on
the ultimate determinants of inflation.
- Medium of exchange - barter is inefficient.
- Unit of account - money is the basic unit for measuring economic value.
- Store of value - money can be used to hold wealth.
- Low return (interest rate) - money pays no interest
- Low risk - money is a "safe" asset in low inflation times
- High liquidity - money is the most liquid asset (money is accepted immediately for
almost all transactions)
Definitions of monetary aggregates
| Symbol |
Assets Included |
Billions of dollars (1996) |
| C |
Currency |
$358.9 |
| M1 |
Currency, demand deposits, traveler's checks, checkable deposits. |
$1,095.3 |
| M2 |
Currency, M1, overnight repos, eurodollars, money market deposit
accounts, money market mutual funds, saving and small time deposits. |
$3,761.1 |
In this class, when we talk about the nominal money supply we will generally be
referring to the monetary aggregate M1. Hereafter, the symbol "M" will
denote M1.
The Federal Reserve Bank (Fed)
The Federal Reserve Bank (Fed) ultimately controls the supply of money in the economy.
(How it does this and how the banking system works is detailed in the lectures on the Fed
and Monetary Policy.) The Fed is the central bank for the U.S. and is a quasi-private
entity (technically owned by private banks) created by the Federal Reserve Act in 1913.
There are twelve regional Federal Reserve Banks across the country and the leadership of
the system is conducted by the Board of Governors of the Federal Reserve System (Federal
Reserve Board ). The Board consists of seven governors, appointed by the President to
staggered fourteen-year terms. The President appoints one Board member as chairman -
currently Allen Greenspan - for a term of four years. It is important to keep in mind that
the Fed operates independently of the federal government. Congress and the President do
not have direct control over the operations of the Fed.
How the Fed Controls the Money Supply
The Fed primarily controls the supply of money (M1) in the economy through what are
called open market operations. These are the
purchase and sale of government bonds by the Fed. The Fed operates the printing presses
for the creation of currency. The Fed also owns a substantial amount of U.S. government
bonds. When the Fed wants to increase the supply of money it
performs an open market purchase of government bonds. That is, the Fed buys
(by printing money) outstanding government bonds from the public or new government bonds
from the Treasury (to finance the current deficit). This operations injects new cash into
the economy. Conversely, when the Fed wants to decease the
amount of money in the economy it performs an open market sale of government bonds.
Here, the Fed sells some of its holdings of government bonds to the public in exchange for
cash. This operation takes cash out of the economy.
Portfolio theory tells us how individuals allocate their wealth among a number of
financial assets (e.g. stocks, bonds, real estate, money). In general an individual's
demand for assets is based on comparing the benefits of costs of holding different kinds
of assets. These costs and benefits are functions of the following assets characteristics:
- Expected return - expected gain (or loss) from
holding an asset over a particular investment horizon
- Risk - the degree of uncertainty in an asset's
return
- Liquidity - the ease and quickness that an asset
can be traded
An individual's demand for money is then based on the costs and benefits of holding
money. As an asset, money has a very low expected return (it pays no interest), is very
safe (the gov't guarantees its nominal value) and is the most liquid asset.
Simplifying assumptions
Since the general asset allocation problem involves many different kinds of assets with
different risk and return characteristics we simplify this decision by assuming that there
are only two kinds of financial assets in the economy.
- Money assets - low return, high liquidity and low
risk. im = nominal interest rate on money assets (very low).
- Non-money assets (bonds) - higher return than on
money assets and less liquidity. We assume that the risk associated with investing in
bonds is not too high (think of government bonds as the generic non-money asset). Let i
denote the nominal interest rate on non-money assets. Note that, by assumption, i
> im. Also, recall that i = r +pe, where r denotes the real return on non-money
assets and pe denotes expected inflation.
Our model for the demand for nominal money balances
takes the following form
Md = P�Ld(Y, i)
where
- Md = demand for nominal money balances (demand for M1)
- Ld = demand for liquidity function
- P = aggregate price level (CPI or GDP deflator)
- Y = real income (real GDP)
- i = nominal interest rate on non-money assets
Discussion
- Nominal money demand is proportional to the price level. For example, if prices go up by
10% then individuals need 10% more money for transactions.
- As Y increases, desired consumption increases and so individuals need more
money for the increased number of desired transactions. This is the liquidity demand for
money.
- As the nominal interest rate on non-money assets (bonds), i, increases the
opportunity cost of holding money increases and so the demand for nominal money balances
decreases.
- Since i = r + pe, we can
decompose the effects on an increase in i into real interest rate increases
(holding expected inflation fixed) and expected inflation increases (holding the real
interest rate fixed).
The demand for real balances
Since the demand for nominal balances is proportional to the aggregate price level, we
can divide both sides of the nominal money demand equation by P. This gives the
liquidity demand function or the demand for real balances
function:
MD = Md/P
= Ld(Y, i)
The left-hand-side of the above equation is the demand for nominal balances divided by
the aggregate price level or the demand for real balances (the real purchasing power of
money). The right-hand side is the liquidity demand function. The demand for real balances
is decomposed into a transactions demand for money (captured by Y) and a
portfolio demand for money (captured by i).
The real money demand function is graphed below:
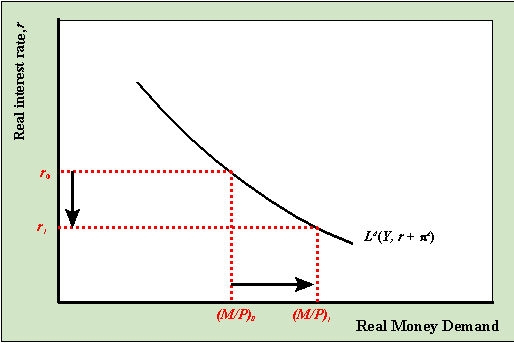
Whenever income or expected inflation change the real money demand curves shifts. For
example, if Y increases the real money demand function shifts up and right; if
expected inflation increases the real money demand function shifts down and left.
Real money demand and the real money supply as functions of the real interest rate are
illustrated in the above graph. Real money demand is graphed holding fixed real income and
expected inflation. The real money supply is equal to the nominal amount of M1,
denoted M0, divided by the fixed aggregate price level, P0.
It is assumed that the Fed does not alter the money supply based on the valued of the real
interest rate. Therefore, the real money supply function is a vertical line in the graph
with the real interest rate on the vertical axis and real money balances on the horizontal
axis.
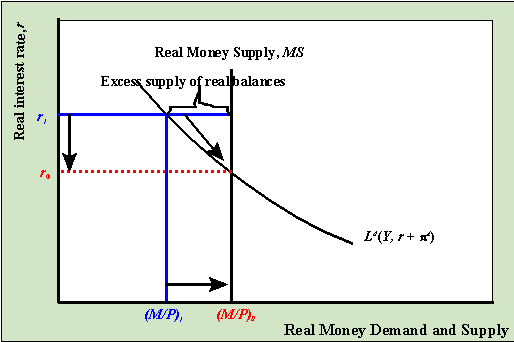
Notice that real money demand and real money supply intersect
when the real interest rate is r0. This is the value of the real
interest that equates money demand with the money supply and establishes equilibrium in
the money market. When the money market is in equilibrium there are no economic forces
acting on the economy to alter the real interest rate.
If the real interest rate were r1 then the demand for real balances
would be greater than the fixed supply of real balances (as illustrated above). In this
case we say there is an excess supply of money in the money market. Practically, what this
means is that individuals are holding more money than they would like given the high real
interest rate. Accordingly, individuals will attempt to rebalance their
portfolios; i.e.
they will try to get rid of money by buying bonds (our generic non-money asset). In doing
so the demand for bonds increases and so the price of bonds increases. Because bond prices
are inversely related to the interest rate on bonds, the increased price of bonds lowers
the real return on bonds (holding expected inflation fixed). Therefore, the excess supply
of money at r1 (dis-equilibrium in the money market) leads
to economic forces that act to lower the real interest rate. These forces cease to operate
when the real interest falls to r0 where the demand for real
balances is equal to the supply of real balances.
Increase in the nominal money supply (M)
Consider the money market initially in equilibrium at r = 6% as illustrated in the
above graph.. Suppose the Fed increases the nominal money supply by an open market
purchase of government bonds. This increases the money supply from M0
to M1. Holding the price level fixed, this increases the supply of
real balances from M0/P0 to M1/P0.
If the real interest rate stays at 6% then the supply of real balances will be greater
than the demand for real balances: there will be an excess supply of money in the money
market. Consequently, individuals will try to get rid of the excess money by buying bonds
which puts downward pressure on the real interest rate (holding expected inflation fixed).
As r drops we move along the liquidity demand curve toward the new equilibrium at
r = 5%.
Increase in the aggregate price level (P)
Consider the money market initially in equilibrium at r = 6% described in the graph
below. Now suppose that the aggregate price level increases from P0 to
P1.
Holding the nominal money supply fixed, this reduces the supply of real balances from
M0/P0
to M0/P1. If the real interest rate stays at 6% the supply of real
balances will be less than the demand for real balances: there will be an excess demand
for money. The excess demand for money will prompt individuals to sell bonds (demand for
bonds falls) and so the real interest rate on bonds will rise. As r rises, we move up
along the liquidity demand curve toward the new equilibrium at r = 7%.
Consider the money market in equilibrium at r = 6% as illustrated above. Suppose that
current income (Y), which is the same as current output (GDP),. Increases from Y0
to Y1. This increases the transactions demand for money as so the real
money demand curve shifts up and to the right. If the real interest rate stays at 6% there
will be an excess demand for money which puts upward pressure on the real interest rate.
As r increases, we move along the money demand curve up towad the new equilibrium at
r =
8%.
