Koyama and Kira (1956) gave impetus to the quantitative study of competition with their analysis of frequency distributions of individual plant weight for dense monspecific stands. They found what we now recognize as the typical right-skewed distribution, with a large number of small plants and few large plants over an extended range of increasing weight, and referred to this as a log normal distribution. The interest of agriculture scientists in the effects of competition on yield meant that plant weight was a focus of many studies. The histogram at top right shows the frequency distribution of weight for 42 day dwarf marigold data with a typical right skewed distribution. The log transformation is shown lower right.
In practice, although generally right skewed, there is considerable variability in the form of weight distributions of plants that have undergone competition. A simple analysis is to calculate the Box-Cox power transformation of the data. BoxCox in the FitAR package in R gives the power exponent lambda closest to normalizing the data. A λ value of zero indicates a log transformation. The λ value for the graphed log weight data (at right) is 0.028 and is not significantly different from zero, so a log transformation of this data normalizes this distribution effectively.


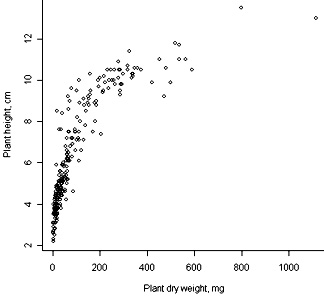

These frequency distributions for plant weight and log plant weight are both clearly different from that for plant height shown on a previous web page. This leads to questions about the form of the relationship between weight and height and what might the relationship tell us? Scatter plots for the same data used previouslyare shown on the left.
The weight:height relationship is clearly non-linear and although the log transformation normalized the weight frequency distribution there is a non-linearity between log weight and height. However, the increase in height relative to weight is different for small compared to large plants.
The break between the two modes for the plant height distribution, calculated on a previous page, is between 7 and 8 cm. Suggestion of this break can be seen in the two graphs above for plant height plotted against weight and against log weight. An informative way to consider the log(weight):height relationship is to smooth the data so that contours of density of points can be drawn. The smoothing technique used here is to make kernel density estimates. This proceedure is equivalent to placing the same, small, two dimensional normal distribution over each individual point and then summing all the contributions from theses distributions obtained as a density for the whole population of points. Obviously where there are many points the density will be greater. There are some important technicalities in using this approach and an introduction and some basic R code is given by Everitt and Hothorn (2006).
The R software package KernSmooth calculates the kernel density estimate and this can then be viewed either as a contour plot (upper right) or a perspective plot (lower right) where a viewing angle, orientation and distance must be selected.
The bimodal structure of this data seems apparent from these plots which have the advantage of not using histogram bins. The same analyses of other data shows that the bimodal structure can vary in both the degree of separation of the modes and in their relative sizes.

