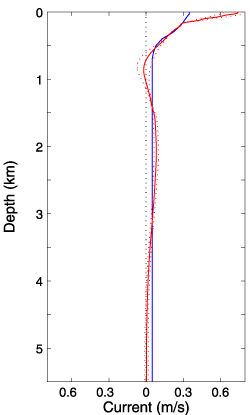
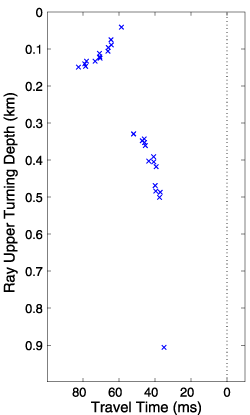
Barotropic Radiation Experiment (BARX)February 14, 2003 The question of how energy flows through the oceans, especially how energy is lost from the currents comprising the general circulation, is receiving much theoretical and modeling attention. This issue is important for understanding not only the structure and transport of the general circulation, but also how water masses and tracers are stirred horizontally and mixed vertically throughout the water column. On theoretical grounds, an important process contributing to the damping of strong currents is radiation of barotropic Rossby waves. The mechanism of Rossby wave excitation by strong meandering currents has been studied extensively by theoreticians in the last two decades. There is some evidence of the existence of this phenomenon between the Gulf Stream and the continental shelf of North America. How much energy this radiation carries away from strong meandering currents, and how fast that energy flux is released to other processes such as diapycnal mixing are issues about which very little is understood. An organized field program specifically aimed at observing radiation toward the open ocean has never been undertaken due to the difficulty of isolating barotropic currents (here meaning simply depth-independent currents). BARX is a 2-year field experiment, proposed to NSF, to deploy an array of instruments especially sensitive to barotropic variability in order to detect and quantify barotropic Rossby wave radiation that escapes the Gulf Stream's recirculation region. Discrimination of the radiated, wind-forced, and baroclinic components of variability will be achieved to a good degree by taking advantage of their different frequency-wavenumber characteristics, and their different signatures in current, pressure, temperature and relative vorticity. The results will lead to new understanding of the importance of this process not only to the damping of the general circulation, but also to the maintenance of the overall level of "background" barotropic variability in the oceans. Such ubiquitous barotropic variablity may play a role in stirring water masses and tracers, both horizontally and vertically, in the deep oceans.In addition to providing an introduction to this project, this web page is meant to provide additional details on the properties of tomographic data, and the inversion of that data for current, that do not appear in the text of the proposal to the National Science Foundation. You can read the complete text of the proposal HERE - baro.pdf (1.7 MB). Principal Investigators: Brian Dushaw (APL-UW, lead institution), Doug Luther (UH), Peter Worcester (SIO), Alan Chave (WHOI), Art Miller (SIO). The Proposed Array: Tomography, Horizontal Electromagnetic Field Recorders, and Bottom Pressure Recorders
This antenna for barotropic radiation will combine point (i.e., horizontal electric field recorders - HEFRs) and line integral (i.e., tomography) observations of current and temperature in an array that will be sensitive to phenomena with length scales of 10-1500 km. The HEFR measurements will observe depth-averaged currents produced by phenomena with horizontal scales as short as 10 km (specifically, twice the ocean depth; Chave and Luther, 1990). Single tomography paths (i.e., between two moorings only) will yield currents and temperature averaged along the path, so that the smaller horizontal scale variability is filtered out. The lengths of the acoustic paths range from 500 to 1200 km. Within southward propagating packets of radiated barotropic Rossby waves, the current variations should be polarized in the northeast-southwest direction, the phase propagation should be northwestward with wavenumbers consistent with the barotropic topographic-Rossby wave dispersion, the group velocity should be southward (likely with a westward component), and there should be oscillatory relative vorticity, concomitant bottom pressure variations, and negligible temperature fluctuations. The array described here has the ability to measure all of these variables. Tomography, Arrival Patterns, and Resolution
The top panel, (a), shows the predicted acoustic arrival pattern for an 800-km long acoustic path along a diagonal of the northern half of the proposed array. Some 30-40 ray arrivals are expected to be resolved for this area of the ocean. The middle panel, (b), shows the horizontal and vertical sampling of the acoustic rays. Some 40 rays may be resolvable in this case. The next panel, (c). shows a nominal sound speed profile, and panel (d) shows the weighted sampling (resolution) with depth of the rays in panel (b). The weighted sampling as a function of depth is a summation of ds/c^2 over range, where ds is an element of ray arc length and c, is sound speed (the peaks occur at the ray turning depths.) The panel at lower right, (e), shows the equivalent depth weighting for the current meters of one of the FASINEX experiment moorings; horizontally, the current meter data offer delta function sampling as well. A Simple Inverse Problem Exercise - Resolution of the Barotropic ModeThe inverse problem involves solving for the current structure using the difference of reciprocal travel times associated with each of the rays shown above. The difference of these travel times is a measure of current because the travel time with the current is different than the travel time against the current.
The integrals along the ray paths of the vertical modes were then calculated, taking
into account the ray weighting, ds/c^2. In this exercise, range independence is
assumed; the result can be readily generalized to include range dependence using
a truncated Fourier series. The inverse involves solving the equation d = G*m + e,
where d is data (differential travel times), G is the matrix of ray-weighted
integrals over the mode functions, and m are mode amplitudes to be solved for. Data
noise is e. The inversion assumes a priori weightings (or variances) for mode
amplitudes and data noise. The first test of the ability of this inverse problem to
resolve the modes is to examine how the a priori uncertainties assumed
for the mode amplitudes compares to the
formal uncertainties for them - by how much has
the assumed variance been reduced?
    0.0400         0         0         0         0         0
         0    0.0400         0         0         0         0
         0         0    0.0400         0         0         0
         0         0         0    0.0400         0         0
         0         0         0         0    0.0400         0
         0         0         0         0         0    0.0400
The first element of this matrix corresponds to the barotropic mode.
(each mode is assumed to have an rms amplitude of sqrt(0.04)=0.2 m/s)
and the final covariance matrix giving the formal uncertainties for the mode amplitudes is
    0.0000   -0.0001    0.0000   -0.0000   -0.0000   -0.0000
   -0.0001    0.0018   -0.0003    0.0002    0.0022    0.0006
    0.0000   -0.0003    0.0001    0.0003   -0.0006   -0.0001
   -0.0000    0.0002    0.0003    0.0019   -0.0006    0.0005
   -0.0000    0.0022   -0.0006   -0.0006    0.0033    0.0006
   -0.0000    0.0006   -0.0001    0.0005    0.0006    0.0003
The diagonal elements of this matrix are much smaller than those of the matrix
above, showing that there is good resolution of all modes in this problem. (Bear
in mind that only 4 significant figures are shown) The
off-diagonal elements of this matrix show the "cross talk" between the modes,
given the ray-path sampling. Comparing the diagonal elements of these matrices
shows that the inverse picks up 99, 95, 99, 95, 91, and 99% of the variance of
mode amplitude. This impressive result is partially a function of the simplicity
of the problem, together with the excellent resolution offered by the set of
ray paths used for this somewhat artificial problem. Nonetheless, these results
demonstrate that
acoustic tomography naturally offers excellent resolution of the barotropic mode.
Related Links: |
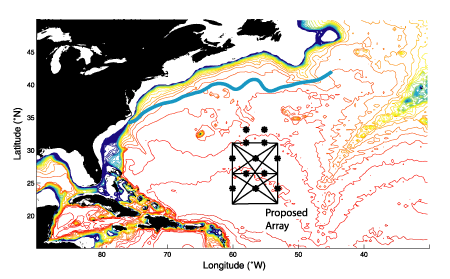 This map shows the proposed array. The stars scattered over the
proposed tomography array show nominal locations of 12
pressure and HEF gauges. The contour lines show potential
vorticity (f/H) (e.g., Koblinsky, 1990). The heavy
blue line to the north is the nominal location of the Gulf Stream.
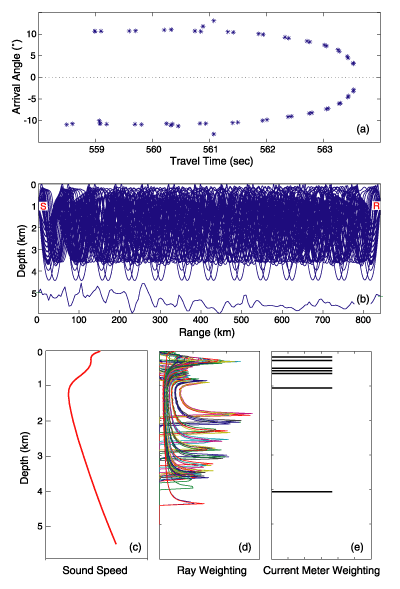 The proposed experiment relies on instruments that are uniquely
capable of observing barotropic currents. The figure to the left
shows some of the properties of sampling offered by ocean acoustic
tomography.
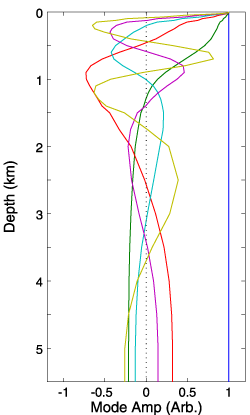 The inverse requires a model for the current - that is, a set of vertical functions for
which the amplitudes are calculated in the inverse. For this exercise, we'll assume that
these vertical functions are dynamical modes. The 2001 World Ocean Atlas was used to
extract profiles of temperature and salinity for the region of the proposed array. These
profiles were then used to calculate sound speed and buoyancy. Buoyancy was then used to
calculate a set of vertical modes; these are shown at right, together with a depth-independent
mode for barotropic current. For the purposes of this
inversion, the modes are normalized so that all of them have a maximum value of 1.
