Transport of Asian Air Pollution to North America
Geophysical Research Letters, Vol. 26, No. 6, Pages 711-714, March 15, 1999
Dan Jaffe
University of Washington Bothell
Theodore Anderson, Dave Covert, and Robert Kotchenruther
University of Washington Seattle
Barbara Trost, Jen Danielson, and William Simpson
University of Alaska-Fairbanks
Terje Berntsen and Sigrun Karlsdottir
University of Oslo; and, Center for International Climate and Environmental Research, Oslo
Donald Blake
University of California-Irvine
Joyce Harris
National Oceanic and Atmospheric Administration-Climate Monitoring and Diagnostics Laboratory
Greg Carmichael
University of Iowa-Center for Global and Regional Environmental Research
Itsushi Uno
Kyushu University-Research Institute for Applied Mechanics
Abstract
Using observations from the Cheeka Peak Observatory in northwestern Washington State during March-April, 1997, we show that Asian anthropogenic emissions significantly impact the concentrations of a large number of atmospheric species in the air arriving to North America during spring. Isentropic back-trajectories can be used to identify possible times when this impact will be felt, however trajectories alone are not sufficient to indicate the presence of Asian pollutants. Detailed chemical and meteorological data from one of these periods (March 29th, 1997) indicates that the surface emissions were lifted into the free troposphere over Asia and then transported to North America in ~6 days.
Introduction
The East Asian region is a large and growing source of NOx, SO2, CO2 and other atmospheric emissions [e.g. Elliot et al., 1997; VanArdeen et al., 1998]. From the mid-1970s to the 1990’s the emissions of both NOx and SO2 from the East Asian region increased at an average rate of ~4%/year. Transport of these pollutants into the central North Pacific atmosphere, especially during spring, has been well established [Prospero and Savoie, 1989; Talbot et al., 1997; Jaffe et al., 1997]. Transport of Asian desert dust to the North Pacific region during spring has also been observed [e.g. Merrill et al., 1989; Xiao et al., 1997]. However, impacts on North America from Asian pollution have not been previously reported.
In this report, we use isentropic back trajectories to identify times when the air sampled at a coastal site in Washington state had recently (within 10 days) been over East Asia. Detection of Asian pollution in these samples is complicated by three factors:
1) the trajectories may be in error or vertical uplift over the source region may be insufficient to raise surface pollutants into the free troposphere;
2) wet or dry deposition, chemical removal or dilution of the pollutants may occur enroute; and,
3) high global background levels or local sources of pollutants may obscure a smaller contribution from distant sources.
Despite these difficulties, our measurements clearly show the impact of Asian industrial emissions, during specific meteorological conditions.
Experimental
Observations of gaseous and aerosol atmospheric constituents were measured during March-April 1997 at the Cheeka Peak Observatory (CPO, 48.3oN 124.6oW, 480m) on the northwest tip of the Olympic Peninsula in Washington State (see Figure 1). This location has been used previously for studies to examine aerosol chemistry and physics [e.g. Anderson, et al., 1998 and references therein]. The site is influenced by air masses characteristic of both the clean marine atmosphere, during westerly flow, and polluted continental air from North America when the winds are from the east. The data presented in this report have been conservatively selected to avoid recent influence from North American sources using local wind direction and particle counts. Additionally, the data were also excluded when the isentropic back-trajectory indicated that the air mass might have crossed over North America.
Because the experimental techniques used for this work have been previously described, only a brief description is given below. CO was measured with a modified commercial non-dispersive infrared instrument [Jaffe et al., 1998]. NO was measured using a high sensitivity chemiluminescent instrument and NO2 was measured as NO following broad band UV photolysis [Beine et al., 1997]. Surface O3 was measured by UV absorption. Peroxyacetyl nitrate (PAN) was measured via gas chromatography with electron capture detection [Beine et al., 1997]. Whole air samples were collected in stainless steel canisters for GC-flame ionization detection analysis of non-methane hydrocarbons (NMHCs) [Blake et al., 1994].
A variety of aerosol properties were also measured as discussed by Anderson et al., [1998]. A condensation particle counter (CPC) was used to measure particle number density for particles with a diameter greater than 10 nm, an integrating nephelometer was used to measure the light scattering coefficient (s sp), and a filter-based absorption photometer measured the light absorption coefficient (s ap), both at 550 nm. Elemental composition (Na and higher atomic numbers) was estimated from proton induced x-ray emission analysis following collection on a rotating drum impactor [Cahill 1995]. Size segregation at 1 um aerodynamic diameter was used to separate the chemical and optical properties of coarse and fine mode particles. Radon gas (Rn), which is a useful continental tracer owing to its 3.8 day half-life and exclusively continental sources, was monitored by detection of radon daughter products captured on a filter [Whittlestone et al., 1996]. Isentropic back trajectories were calculated using data from the European Center for Medium Range Weather Forecasting (ECMWF) and the methodology described in Harris et al. [1992].
Results
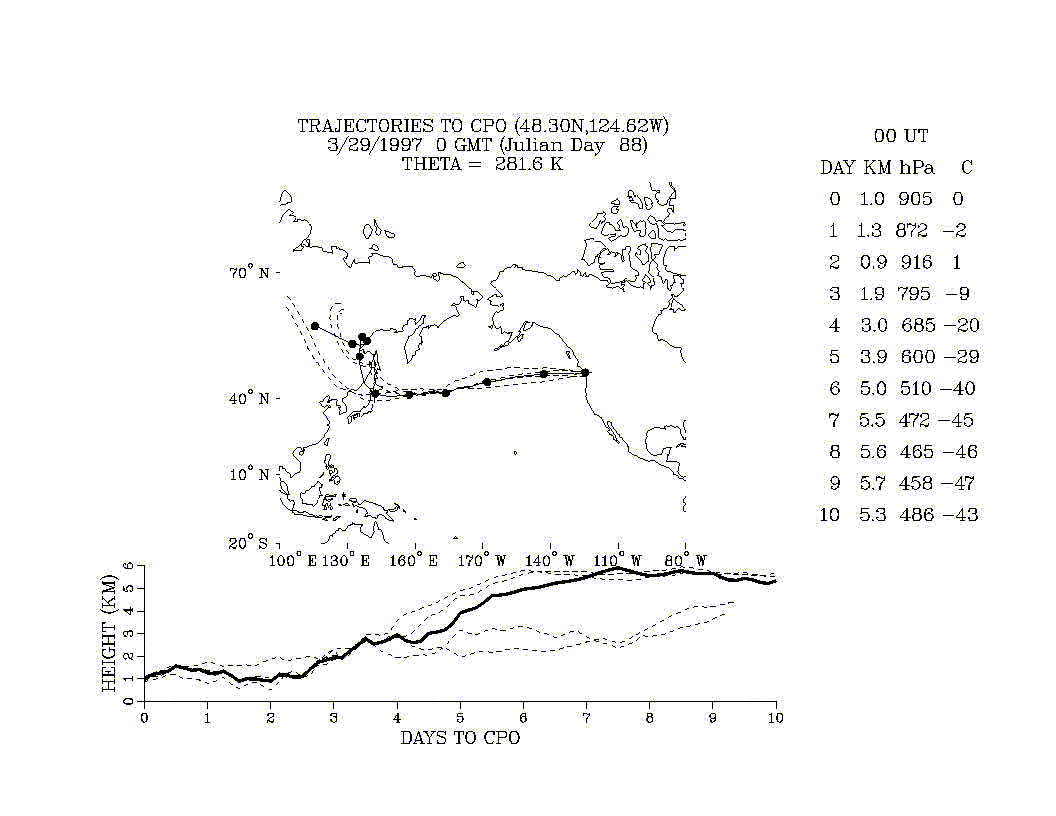
The mean concentration for CO, O3, PAN, Rn, NMHCs, aerosol number density, scattering coefficient and absorption coefficient for the westerly, marine data obtained during March-April, 1997 are given in Table 1. For each day of the campaign, 10-day isentropic back-trajectories arriving at the CPO site (00+12 UTC) were calculated. During this period 16 out of 122 trajectories (13%) crossed over the northern region of East Asia (defined by 30-50o N and 100-150o E). In this paper, these trajectories will be referred to as "Asian trajectories". Figure 1 shows one such trajectory for an air parcel that arrived at CPO on March 29th, 1997. These 16 trajectories took an average of 6.9 days to reach North America from Asia and were at an average height of 2.9 km when crossing over the Asian region.
For the time periods when the trajectory originated over Asia we examined the data to see whether or not enhanced concentrations were observed (data were included for +/- 6 hours around each trajectory time). The data, segregated by trajectory type, are shown in Table 1. As described above, data were excluded during periods when there was any possible influence from north American sources. Using t-tests, we found that CO, PAN, Rn, CPC, s sp, and s ap were all statistically elevated at a 95% confidence level or greater when the trajectory originated over Asia. Note that O3 was not elevated during the Asian trajectory periods. In conducting this statistical analysis, it is necessary to consider both the fact that some variables are log-normally distributed (CPC, s sp, and s ap) and the presence of autocorrelation in the hourly averaged data. Both of these factors were taken into account in conducting this analysis. This analysis was conducted using several different methods. In one approach we used the hourly data and corrected for the presence of auto-correlation. In a second approach we used 12 hour averaged data (which has no auto-correlation) centered on the trajectory times (00 and 12 UTC). Both analyses gave identical results. Also shown in Table 1 is the data for March 29th, a period with an Asian trajectory and significant enhancements in all of the measured species except ozone. This time will be discussed in more detail below.
However despite the results presented above, several points must be noted. First, there were times when an Asian trajectory was calculated and yet the concentrations were not enhanced. For example, on March 27th CO, PAN, Rn and the aerosol absorption coefficient were essentially indistinguishable from the marine average, despite a back-trajectory that crossed over the east Asian region. Thus, the trajectories by themselves can not be used to identify times when enhanced Asian pollution is present. Second, we believe that during periods when 10 day back trajectories did not cross over Asia, there is, nonetheless, an influence from anthropogenic sources in Asia. This point is discussed in more detail at the end of this section.
The average concentrations for the Asian trajectory periods, shown in Table 1, were calculated from data obtained on March 8th, 9th, 10th, 11th, 27th, 29th, and 30th, all periods with one or more Asian trajectories. The data from March 29-30 reflect the strongest Asian influence and the data on March 27th the weakest. If the March 29-30th data are excluded from the analysis, the levels of CO, PAN, Rn, CPC, s sp, and s ap for the Asian cases are still enhanced compared to the marine average, however the statistical significance goes away for most of the aerosol parameters. For CO and PAN, the differences are still significant at a 95% confidence level.
A small number of NMHC samples were also obtained during the March-April campaign. Of these, only one sample (March 29th) was obtained during a period with an Asian trajectory. The NMHC data for the entire period and the 3/29/97 sample are shown in Table 2. Also shown in Table 2 are NMHC data taken from aircraft samples near the coast of east Asia during the spring 1994 "PEM-West B" campaign, during periods when relatively fresh (<2 days) Asian emissions were being sampled [Talbot et al., 1997]. The similarity of the Cheeka Peak NMHC data on 3/29/97 with the observations off the coast of Asia add further evidence that the CPO site was sampling air that had been influenced by Asian emissions only a few days earlier. In fact the similarity of NMHC concentrations is striking and would imply that on 3/29/97 an east Asian airmass had been transported to the coast of North America with only modest losses due to dilution or chemical removal.
Since all of the combustion tracers we measured were enhanced on March 29th (except NOx), this event was examined in more detail. Between 25-29 March 1997 strong westerly flow prevailed over most of the North Pacific region. The back trajectories for 0 and 12 UTC on 3/29/97 (shown in Figure 1) indicate that the air sampled at CPO moved rapidly across the Pacific, having been over Asia 6 days prior. Figure 2 shows the 700 mb pressure surface and wind vectors in the North Pacific on 3/27/97. At this time the air parcel sampled on 3/29/97 was approximately half way across the Pacific. The plots for 3/25-29/97 are all qualitatively similar to Figure 2. The 700 mb heights shows that the rapid transport was a result of a stationary low pressure system centered near the Alaska Peninsula combined with a high pressure system centered around 35oN 160oW. At that time the winds between the two systems at 2.8 km were approximately 30 meters/second. We calculated additional trajectories for the region around the CPO location using variable arrival heights (350, 500 and 1000 meters) and by changing the arrival location to the corners of a 1ox1o box centered on the site (also shown in Figure 1). In all cases, these trajectories were similar to the one arriving at the actual station location. In addition, the 00 and 12 UTC soundings from Quillayute, 40 km south of CPO, showed that the winds throughout the lower troposphere on 3/29/97 were from the west. The observations on 3/29/97 show that gaseous species CO, PAN, Rn and a number of NMHCs are significantly elevated. Aerosol number density (CPC), scattering coefficient (s sp) and absorption coefficient (s ap) are also significantly elevated compared to the marine average. Note that O3, propene, hexane, C2Cl4 and NOx (not shown) were not significantly enhanced in this air mass. For hexane and NOx this can be explained by their short atmospheric lifetimes. For propene, this could be due to its short lifetime, but also since there is a significant marine source, its average concentration is already high. For C2Cl4 the mixing ratio observed on 3/29/97, 13 pptv, is nearly identical to the mean value observed for the entire March-April campaign. This is significantly higher than the 2-4 pptv reported for Mauna Loa [Atlas and Ridley, 1996], but less than the mean 0-2 km "Asian continental outflow" value of 21 pptv, reported by Talbot et al. [1997].
Elevated aerosol particle concentrations can be attributed to combustion sources (as indicated by CO, PAN, and s ap) and to seasalt (as indicated by high levels of particulate Na, Cl, and Mg). Low concentrations of Al, Si, and Fe at this time indicate that mineral dust was not a significant component of these particles. The high seasalt loadings are consistent with strong westerly surface winds (~20 m/s) which were present in the marine boundary layer (MBL) during the previous 3 days. The trajectory indicates that the air parcel sampled on 3/29/97 had been in the MBL during this period.
Since biomass burning sources emit much smaller amounts of branched alkanes, compared to straight chain alkanes [Blake et al., 1996], the elevated levels of i-butane and i-pentane on 3/29/97 suggest an urban or industrial source, rather than a biomass burning source. Rn is a natural soil product and its enhanced concentration during the 3/29/97 event is evidence that this airmass was influenced by recent continental emissions.
To assess whether the frequency of trajectories arriving at CPO from March-April 1997 was within the normal range we examined four years of 10 day isentropic back trajectories calculated twice daily (00+12 UTC) which arrived at the CPO site. A trajectory was considered to have crossed over East Asia if it went over the region between 0-50oN latitude and 100-150oE longitude. However it must be emphasized that since these trajectories do not originate in the boundary layer, not all such trajectories will bring pollutants with them as discussed above. For March and April 1994, 1995, and 1996 the number of CPO back trajectories which cross over Asia was 18, 10, and 12, respectively, compared to 16 observed during March-April 1997. Thus the spring 1997 data are not especially unusual in this respect.
As mentioned above, we do not believe that an Asian influence on the mixing ratios is felt only during periods when the trajectories cross over Asia. The mean mixing ratios for most species observed at CPO during the spring of 1997 are significantly higher than data observed at many other background locations. For example, the mean CO and C2H6 mixing ratios at Cheeka Peak observed during the spring of 1997 were 151 ppbv and 1707 pptv, compared with 129 ppbv and 1027 pptv, respectively, observed during the spring of 1992 at Mauna Loa [Atlas and Ridley, 1996]. The higher mixing ratios at CPO reflect not only differences in altitude and latitude, but also the stronger westerly flow in the 30-50oN latitude band, as compared to Mauna Loa.
To assess the contribution of Asian sources to the Cheeka Peak mean mixing ratios, we used a global 3-dimensional chemical transport model (CTM) [Berntsen et al., 1996]. Using this model we calculate good agreement with the observed mean spring mixing ratios for CO, PAN, and O3, and conclude that 22% of the observed CO at CPO is due to emissions in the East Asian region. Details on these calculations are in the paper by Berntsen et al. [Influence of Asian emissions on background levels of pollutants in the Eastern Pacific. Submitted to Geophys.Res.Letts.. January 1999].
To further investigate and verify the influence of Asian sources on North America for the 3/29/97 event, simulations of long range transport were performed using the CSU-RAMS (Colorado State University - Regional Atmospheric Modeling System) meteorological model (Pielke et al., 1992). The model domain (shown in Figure 3) includes both East Asia and much of North America, with a horizontal resolution of 200 km and twenty vertical layers from the surface to ~14 km. This meteorological model is designed to provide detailed three-dimensional meteorological fields that represent the large-scale features of specific meteorological events. In this study numerical calculations were performed for the period March 15, 00 UTC to March 30, 12 UTC.
To track the transport of pollutants from East Asia within this event, calculations of pollutant transport were performed using an on-line tracer model i.e., the pollutant transport is done inside (and simultaneously with) the meteorological calculation. The inert tracer was emitted continuously near the surface (0-350m) on a horizontal grid with a distribution identical to the known anthropogenic sulfur dioxide emissions (Xiao et al., 1997). Separate tracers representing, surface emissions of SO2 from Asia and North America were used. Shown in Figure 3 is the calculated Asian tracer distribution along with the horizontal streamlines at 2 km. The Asian emissions during this period were transported out of the boundary layer, but were largely restricted to the lower 3 km of the atmosphere, reaching the west coast of Washington state on the 29th of March. The regional modeling gives a similar cross-Pacific transport time as the isentropic trajectory for this event, however the two calculations disagree slightly on the height of the transport. The RAMS calculation indicates that the transport took place below 3 km, whereas the isentropic trajectory indicates that the transport, initially, was at a somewhat higher elevation. This is a result of the very different assumptions inherent in each approach.
Summary
Using observations of atmospheric carbon monoxide, ozone, peroxyacetyl nitrate, Radon, aerosols, and non-methane hydrocarbons made at the Cheeka Peak Observatory in Washington State during March-April 1997 we show that emissions from East Asia significantly impact the air arriving to North America. Isentropic trajectories are a useful, but by themselves insufficient, indicator as to when this transport occurs. Due to the uncertainties of the isentropic trajectories, we do not attempt to identify specific source regions.
Acknowledgments. The authors wish to thank a number of people who assisted with this work including Tom Cahill and Kevin Perry (UC-Davis), Ivar Isaksen (U-Oslo) and Jamie Anderson (U-Washington). The observations at the Cheeka Peak Observatory were supported by the National Science Foundation (grant# ATM 9529604). The regional modeling was supported by NASA (grant# NAG5-3855).
References
Anderson T.L., Covert D.S., Wheeler J.D., Harris J.M., Perry K.D., Trost B.E., and Jaffe D.A., Aerosol backscatter fraction and single scattering albedo: Measured values and uncertainties at a coastal station in the Pacific Northwest. Submitted Sept. 19, 1998 to J.Geophys.Res.
Atlas E.A. and B.A. Ridley. The Mauna Loa Observatory Photochemistry Experiment, J.Geophys.Res., 101, 14,531-14,541,1996.
Beine, H.J., Daniel A. Jaffe, John A. Herring, Jennifer A. Kelley, Terje Krognes, Frode Stordal. High Latitude Springtime Photochemistry Part I: NOx, PAN and Ozone Relationships J.Atm.Chemistry 27, 127-153,1997.
Berntsen, T., and I.S.A. Isaksen, A global three-dimensional chemical transport model for the troposphere;1. Model description and CO and ozone results. J. Geophys. Res. 102, 21,239-21,280, 1997.
Blake, D. R., T. W. Smith, Jr., T. -Y. Chen, W. J. Whipple, and F. S. Rowland, Effects of biomass burning on summertime nonmethane hydrocarbon concentrations in the Canadian wetlands, J. Geophys. Res., 99, 1699-1719, 1994.
Blake N.J., Blake D.R., Sive B.C., Chen T.Y-, Rowland F.S., Collins J.E., Sachse G.W., and Anderson B.E. Biomass burning emissions and vertical distribution of atmospheric methyl halides and other reduced carbon gases in the south Atlantic region. J.Geophys.Res. 101, 24,151-24,164, 1996.
Cahill, T.A., Composition analysis of atmospheric aerosols. In Johansson, S.A.E. (ed), Particle Induced X-Ray Emission Spectrometry, Wiley and Sons, New York, 237-311, 1995.
Elliot S., Blake D.R., Duce R.A., Lai C.A., McCreary I., McNair L.A., Rowland F.S., Russell A.G., Streit G.E., and Turco R.P. Motorization of China implies changes in pacific air chemistry and primary production. Geophys.Res.Letts. 24, 2671-2674, 1997.
Harris, J.M., P.P. Tans, E.J. Dlugokencky, K.A. Masarie, P.M. Lang, S. Whittlestone, and L.P. Steele, Variations in atmospheric methane at Mauna Loa Observatory related to long-range transport, J. Geophys. Res., 97, 6003-6010, 1992.
Jaffe, D.A., L.N. Yurganov, E. Pullman, J. Reuter, A. Mahura, and P.C. Novelli. Measurements of CO and O3 at Shemya, Alaska. J. Geophys. Res. 103, 1493-1502, 1998.
Jaffe, D.A., Mahura A., Kelley, J., Atkins J., Novelli P.C. and Merrill J. Impact of Asian Emissions on the Remote North Pacific Atmosphere: Interpretation of CO Data from Shemya, Guam, Midway and Mauna Loa. J.Geophys.Res. 23, 28,627-28,636, 1997.
Merrill, J.T., M. Uematsu, and R. Bleck, Meteorological analysis of long range transport of mineral aerosols over the North Pacific, J. Geophys. Res., 94, 8584-8598, 1989.
Pielke, R.A et al., A comprehensive meteorological modeling system- RAMS. Meteor. Atmos. Phys., 49, 69-91, 1992.
Prospero, J.M. and D.L. Savoie, Effect of continental sources of nitrate concentrations over the Pacific Ocean, Nature, 339, 687-689, 1989.
Talbot R.W. et al., Chemical characteristics of continental outflow from Asia to the troposphere over the western Pacific Ocean during February-March 1994: Results from PEM-West B. J.Geophys.Res. 102, 28,255-28,274, 1997.
VanAardeen, G. Carmichael, D. Streets, H. Levy, and L. Hordijk, NOx emissions in Asia from Anthropogenic Activities, Atmos. Env., in press, 1998.
Whittlestone, S.E., Schery S.D., and Li Y. Thoron and Radon fluxes from the island of Hawaii. J.Geophys.Res. 101, 14,787-14,794, 1996.
Xiao, H., Carmichael G., Durchenwald J., Thorton D., and Bandy A. Longrange transport of SOx and dust in east asia during the PEM-WEST-B experiment. J. Geophys. Res., 102, 28589-28612, 1997.
(Received November 11, 1998; revised January 21, 1999;
accepted Januayr 27, 1999.)
Table 1. Average and Standard Deviation for Marine Data (N=834) Obtained at the Cheeka Peak Observatory During March-April 1997 and Data for Specific Time Periods.
|
|
N Hours |
CO ppbv |
PAN pptr |
CPC #/cc |
s apMm-1 |
s spMm-1 |
Rn mBq/m3 |
O3 ppbv |
|
All marine data (mean +/- 1 s ) |
834 |
151+/- 14 |
79+/- 59 |
480 +/- 436 |
0.22 +/- 0.45 |
4.4 +/- 4.0 |
588 +/- 310 |
44 +/- 4 |
|
Non-Asian trajectories |
748 |
150 |
71 |
458 |
0.14 |
3.6 |
562 |
44 |
|
Asian trajectories* |
86 |
168 (Y) |
146 (Y) |
695 (Y) |
0.83 (Y) |
10.3 (Y) |
811 (Y) |
44 (N) |
|
3/29/97 (00-24 UTC) |
24 |
173 (Y) |
201 (Y) |
658 (Y) |
2.0 (Y) |
19.1 (Y) |
1150 (Y) |
45 (N) |
* This refers to back-trajectories that crossed over the east Asian region as defined in the text. A yes (Y) indicates that the value is significantly different from the remainder of the marine data at a 95% confidence level (see text).
Table 2. Mean (+/- 1 s.d.) Non-Methane Hydrocarbon Measurements at CPO During Spring 1997 and During the PEM-West B Campaign off the Coast of Asia During Strong Outflow Periods [Talbot et al., 1997].
|
C2H6 pptv |
C2H4 pptv |
C3H8 pptv |
n-C4H10 pptv |
i-C4H10 pptv |
C2H2 pptv |
i-C5H12 pptv |
n-C5H12 pptv |
C6H6 pptv |
|
|
CPO, Marine data (n=11) |
1707 +/- 190 |
124 +/- 73 |
433 +/- 220 |
107 +/- 75 |
78 +/- 61 |
263 +/- 158 |
57 +/- 42 |
44 +/- 38 |
144 +/- 65 |
|
CPO, 3/29/97 (n=1) |
2373 (Y) |
275 (Y) |
913 (Y) |
237 (Y) |
134 (Y) |
603 (Y) |
101 (Y) |
78 (Y) |
185 (Y) |
|
PEMB,Spring 1994 |
2337 |
183 |
961 |
330 |
173 |
908 |
89 |
58 |
180 |
A yes (Y) indicates that the value is outside of the 95% confidence interval for the marine data.
Click on links below to see figures:
Figure 1. Isentropic trajectory for 3/29/97 at 00 UTC arriving at an elevation of 1000 meters. The solid line shows the trajectory arriving to the station coordinates and the dashed lines show trajectories arriving on a 1ox1o box around the station coordinates. Trajectories for arrival heights of 350 and 500 meters (not shown) are nearly identical. The dots are shown at one day intervals.