|
Date/doy |
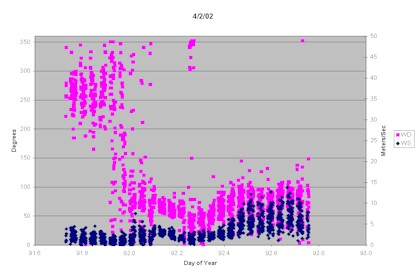
WS/WD |
T/RH |
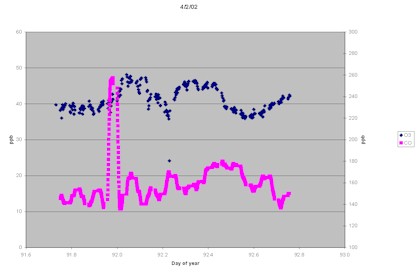
CO/O3 |
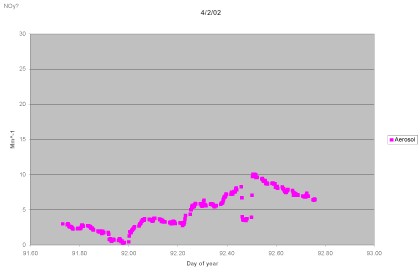
Aerosol scatter (total scatter, green)/NOy |
Hg(0)/Reactive Gaseous Hg |
CPO field report |
|
April 1, 2002:91 |
||||||
|
April 2, 2002:92 |
||||||
|
April 3, 2002:93 |
||||||
|
April 4, 2002: 94 |