Land Uplift in the Santa Clara Valley, California
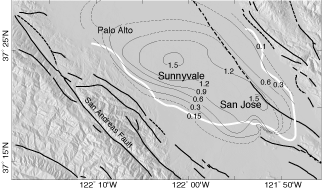
 Land subsidence, or the sinking of the earth's surface, is often observed above major aquifers as ground water is pumped out of confined systems. The pumpage of ground water results in a drop in pore pressure which supports the vertical load of the sedimentary strata. This is accompanied by a settling of grains in the clay layers resulting in the irreversible compaction of sediments. In the Santa Clara Valley, the surface of the earth subsided more than 4 m from 1912 to 1966 because of excessive ground water pumpage. The unchecked withdrawal of ground water presents several social and economic problems such as the failure of underground pipes and the redirection of surface runoff during episodes of flooding. Water agencies attempt to minimize these complications by finding the balance between ground water withdrawal and recharge.
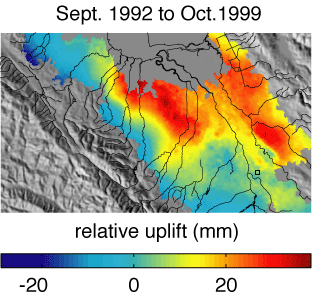
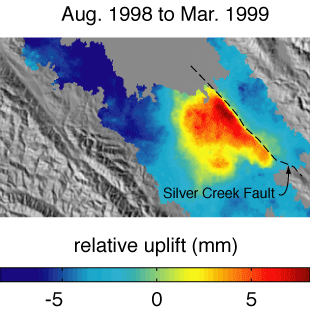
Interferometric Synthetic Aperture Radar (InSAR) can be used to monitor the land subsidence in a given region. We processed 115 differential interferograms using SAR data collected by the ERS1/2 satellite. To synthesize the information contained in all of the InSAR data, we developed a linear inversion scheme that solves for a range-change time series (view animation of result, SCV97-00.avi, 11 Mb). The InSAR time series resolves the spatial and temporal pattern of deformation. Since 1992, we observe that the surface of the earth has uplifted in the Santa Clara valley attributed to the recovery of ground water levels in the confined aquifer. This has largely been accomplished through the recharge of the aquifer through the creation of percolation ponds in the 1960's and the importation of water to offset municipal water consumption. In addition to the uplift signal, we resolve a seasonal uplift signal associated with the seasonal redistribution of ground water. In future work, we plan to numerically model the seasonal deformation to help provide constraints on the properties of the aquifer.
For a full description, read Schmidt and Burgmann (2003).


