An InSAR study of the surface deformation of Duvall Mw 5.1 earthquake
Abstract
The Duvall Mw 5.1 earthquake, the second biggest earthquake in Washington since 1966, occurred about 10 km east of Duvall on May 3, 1996, and was followed by intense aftershocks. We use four SAR scenes from ERS 2 satellite and produce four Interferometric Synthetic Aperture Radar (InSAR) images spanning the earthquake to map the surface deformation. No detectable signal clearly shows up on any one of or on the stacking of the four InSAR images. The fail to identify signal is possibly due to the data limitation, most likely the baseline decorrelation and temporal decorrelation. On the other hand, we can not rule out the possibility that the event is too deep (10 km or deeper) to generate surface deformation that is large enough to be seen by InSAR. In addition, the specific geometry of the satellite looking direction and fault slip in this study might result in subtle range change in InSAR, even though there was considerable true deformation. Investigating other available SAR data, especially with short perpendicular baseline, and other available geodetic measurements would potentially provide better constraint on the surface deformation and thus better understanding of the earthquake generation and hazard in this area.
1. Introduction
Interferograms from two synthetic aperture radar (SAR) scenes can be used to map the surface deformation associated with various tectonic processes (e.g., Massonnet and Feigl, 1998; Burgmann et al., 2000) as well as the topography (e.g. Burgmann et al., 2000). One important application of InSAR is to study earthquakes, including both the coseismic deformation (e.g., Massonnet et al., 1993) and the postseismic deformation (e.g., Massonnet et al., 1994; Fialko, 2004; Jacobs et al, 2002). InSAR measurements complement GPS data by providing a spatially continuous mapping of the surface deformation, and are especially useful at those regions where GPS observations are sparse (Massonnet et al., 1994; Lohman and Simons, 2005) and even the target fields are unreachable. Therefore, InSAR is useful to constrain the earthquake source parameters and to estimate the earthquake hazards.
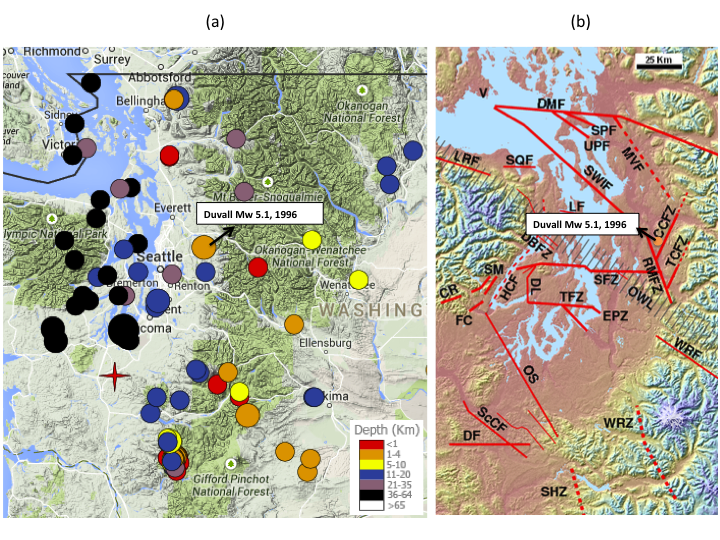
In Pacific Northwest, there are three earthquake mechanisms that put threat of damage to the communities in Puget Sound area. First, there are shallow earthquakes that occurred in North American continental crust (e.g., events with depth less than about 30 km in figure 1a); second, the megathrust earthquakes at the west coast occur at the plate interface between Juan de Fuca and North American plates; the third category include those events occurring within the subducting Juan de Fuca slab (e.g., events deeper than about 30 km in figure 1a). Because of the shallow depth and very nearby proximity to the heavily populated communities, those crustal quakes belong to one of the major consideration as for earthquake hazard evaluation and mitigation in Puget Sound region. Also, the study of these crustal earthquakes can contribute to better understand the stress status and deformation process at the Cascadia subduction plate boundary.
Figure 1. (a) The earthquakes with magnitude equal to or greater than 4.0 in western Washington since 1996 (from PNSN catalog). The red, orange, yellow, blue and maybe some dark orchid dots represent continental crust earthquakes. The black and maybe some dark orchid dots represent subducting intraslab earthquakes. The Duvall Mw 5.1 earthquake is noted with a black arrow. (b) The principal Puget Sound faults are delineated with solid or dashed red lines (from http://en.wikipedia.org/wiki/Puget_Sound_faults). The orange dot around the intersection of Cherry Creek Fault Zone (CCFZ) and Rattlesnake Mountain Fault Zone (RMFZ) indicates the location of the Duvall Mw 5.1 main shock and also is noted with a black arrow.
On May 3, 1996 an Mw 5.1 earthquake happened at about 10 km east of the town of Duvall (hereafter named Duvall earthquake). The foci depth for this earthquake is 4.4 km and the epicenter is N 47.761, W121.876 which are given by Pacific Northwest Seismic Network (PNSN) (figure 1). The location of this quake is 40 km east-northeast of Seattle, and it shook parts of the Washington state and other area such as southern British (Cassidy et al., 1997).
The Duvall Mw 5.1 earthquake is the biggest crustal earthquake in Washington since 1966, and was the biggest earthquake in Washington until the 2001 Nisqually earthquake. Figure 1(a) shows the earthquakes with magnitude equal to or bigger than 4 in western Washington since January 1996.
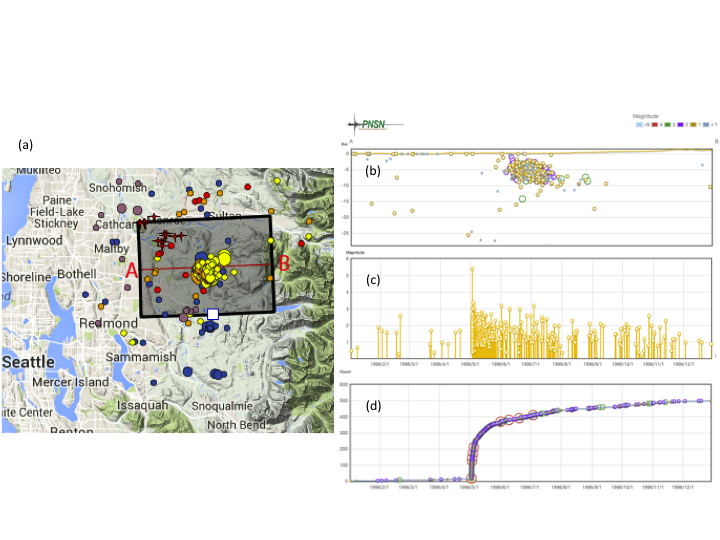
The depth of the Duvall earthquake is 4.4 km, and main shock was followed by a lot of aftershocks. Figure 2 shows the temporal and spatial distribution of the main shock and aftershock sequence. The aftershocks concentrated around 5 km in the upper crust and the distribution pattern imply they occurred on an eastward dipping fault.
Figure 1(b) shows the principal Puget Sound geologic faults (http://en.wikipedia.org/wiki/Puget_Sound_faults). One important question is whether the Duvall earthquake as well as its aftershocks ruptured one of these faults or they occurred on some other unknown faults. The answering of this question will surely help to understand the fault activity and earthquake deformation, and to reevaluate the local and regional earthquake risk in the future.
Based on the location constrained by seismic data, the Duvall earthquake is likely to have ruptured on either the Cherry Creek Fault Zone (CCFZ) or Rattlesnake Mount Fault Zone (RMFZ) (figure 1(b)), given the uncertainty of the event location. The earthquake focal mechanism solution gave two potential fault planes with strike, dip and rake of 10o, 60o, 100o and 171o, 31o, 74o respectively (given by PNSN). The first fault plane with strike of 10o, dip of 60o and rake of 100o is probably the true plane that corresponded for the seismic slip of the Duvall event for two reasons. First, the event location is closer to the CCFZ which strikes north-northeast. Second, from the aftershock distribution (figure 2(b)), it is very clear that the fault dip eastward rather than westward. The first faulting mechanism is used in the InSAR simulation later in this paper.
Figure 2. Duvall Mw 5.1 main shock and the aftershock sequence. (a) Spatial distribution of the seismicity in 1996. The meanings of different colors are same as those in figure 1(a). A-B is a profile with events only within the rectangular box analyzed in (b), ( c) and (d). (b) A west-east depth profile shows the depth distribution of the events within the rectangular box in (a). Notice that the seismicity geometry clearly delineates an eastward dipping fault plane. ('c') The timeline of the magnitude across the whole year 1996. Notice that the Duvall Mw 5.1 main shock was followed by a lot of aftershocks and the aftershocks continued at least to the end of the year 1996. (d) Cumulative quake number of the earthquake sequence within the profile box.
Although the focal mechanism might be well constrained by the seismic data from seismic network, the uncertainty in the epicenter determination and the focal depth can be big and make it difficult for us to tell exactly on which fault have the Duvall event ruptured. The major motivation of this study is to better constrain the earthquake parameter of the Duvall event, especially its horizontal and depth location, by using the spatially continuous InSAR images.
We should mention that the reason why we choose this earthquake is not only because of the bigger magnitude compared with other crustal earthquakes. Also, the earthquake has a shallow depth with 4.4 km (from PNSN). Given that this earthquake occurred at a shallow depth, it is possible that coseismic surface deformation can be large enough to be seen using InSAR.
In this work, we collect available SAR scenes from satellite ERS 2 to produce interferograms spanning the event, and map the coseismic surface deformation associated with the main shock and potentially its aftershocks. In the following sections, we first describe the data and method that we used in this study. Then, we show the InSAR images and discuss the results and make error analysis and discuss the possible causes that limit us to get a detectable signal from InSAR images.
2. Data and Methods
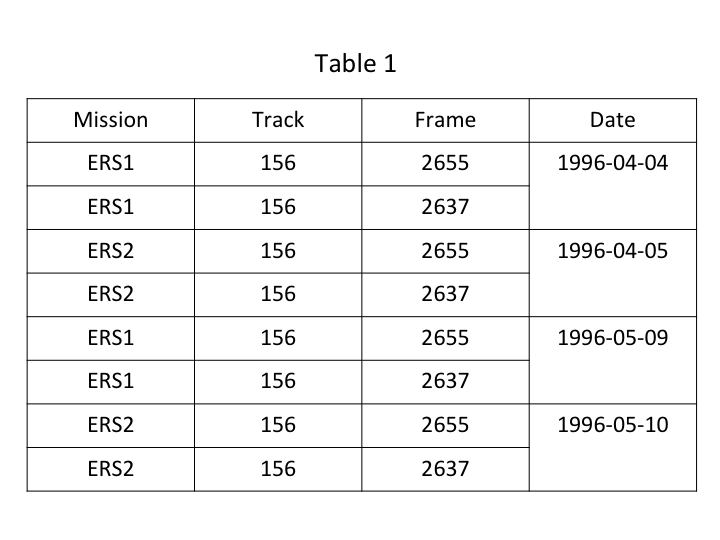
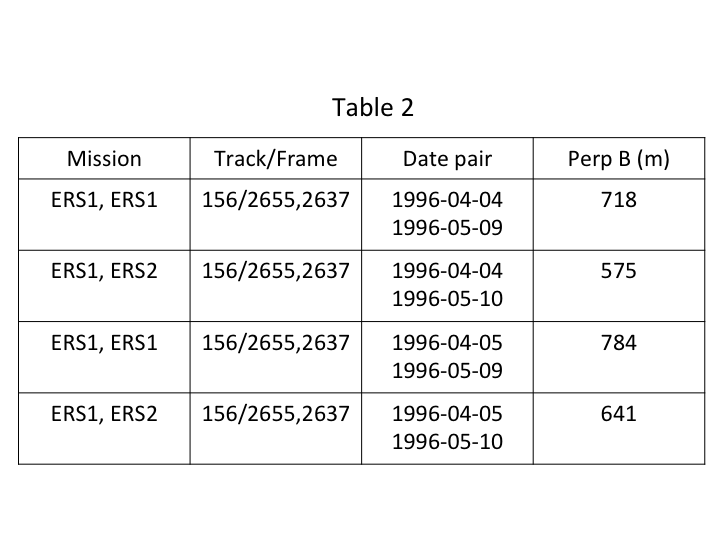
The Duvall earthquake occurred about 10 km east of Duvall, Washington on May 3, 1996. The quake area was imaged both before and after the main shock by satellites ERS 1 and ERS 2. We collect four SAR scenes spanning the earthquake, two of which are about one month before the quake and the other two scenes are about one week after the quake. Because the event is located at the edge of the frame, we merged two frames to achieve scenes continuously mapping the Duvall earthquake. The details of the four scenes are shown in table 1. We make a combination of the different SAR scenes before and after the earthquake, and get four date pairs scenes to process for potential interferograms. The date pair scenes must share the same track and frame. These date pairs are shown in table 2. Notice that the perpendicular baseline for each scene pair might be too big to achieve a highly correlated interferograms. We will analyze the baseline effect on the correlation of the phase later in the discussion section.
To obtain the interferogram for each date pair, we perform standard processing both for the master scene and the slave scene with the Repeat Orbit Interferometry Package (ROI_PAC). The interferometric phase contains a topography component that needs to be corrected to get a differential interferogram for deformation interpretation. We first construct digital elevation model (DEM) for the study area using data from Shuttle Radar Topography Mapping (SRTM) mission (http://dds.cr.usgs.gov/srtm). Then we use this DEM and the ROI_PAC to estimate and remove the topography contribution to the interferometric phase.
For all of these four date pairs, we perform the same processing and finally obtain four interferograms with amplitude and wrapped phase. Because there are low correlations in all of the four interferograms, we are unable to wrap the phase. We will show the interferograms with wrapped phase in the next section.
3. Results
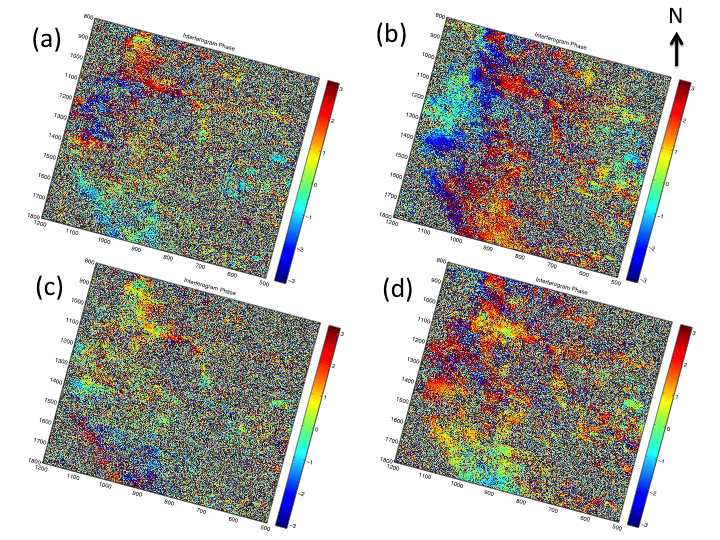
After the process of the SAR data, we finally obtain four interferograms for the Duvall earthquake (see table 2 for date pair details). The wrapped phases for these four interferograms are shown in figure 3. In spite of some coherent phase in some part of InSAR images, there are low correlations near the epicenter of the Duvall shock. No detectable signal associated with the earthquake can be identified on these four interferograms. The phases near the earthquake location is very noisy, indicating decorrelation from data limitation and/or the surface deformation associated with the main shock is not large enough to be seen by InSAR.
Figure 3. Interferogram wrapped phase using (a) SAR scenes of April 4, 1996 and May 9, 1996; (b) SAR scenes of April 4, 1996 and May 10, 1996; © SAR scenes of April 5, 1996 and May 9, 1996; (d) SAR scenes of April 5, 1996 and May 10, 1996. All of the four interferograms show low phase corrlation at the epicenter region.
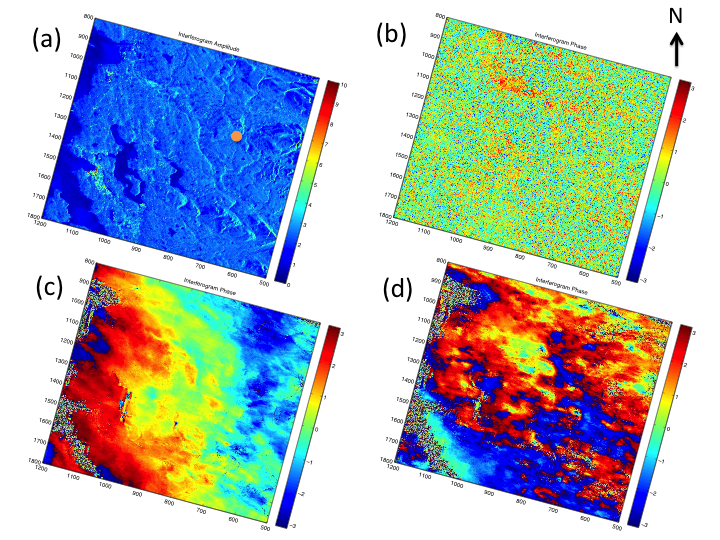
Figure 4. Interferogram amplitude and phase. (a) The amplitude stacking of the four interferograms. The orange dot represents the Duvall earthquake location. (b) The phase stacking of the four interferograms in fiure 3. Notice that the correlation is still low, at least near the epicenter of the earthquake. © Interferogram phase using SAR scenes of 1996.04.04 and 1996.04.05. For this date pair the correlation is high, probably because of the short perpendicular baseline (only 66 m) and short time span (only one day). (d) Interferogram phase using SAR scenes of 1996.05.09 and 1996.05.10. The correlation for this scene pair is also high, with same reason of short perpendicular baseline (about 143 m) and short period (only one day).
To enhance the potentially existing deformation signal, we make a stacking for the four interferometric phases (figure 4(b)). By stacking the incoherent phase for each pixel is partially reduced and the spatial coherent signal may show up if there were any. However, the phase near the earthquake is still low correlated and we are still unable to see any detectable deformation signal.
To check the corresponding causes for the low correlation in the interferograms, we also produce two interferograms using SAR scenes both before (April 4, 1996 and April 5, 1996) and after (May 9, 1996 and May 10, 1996) the Duvall earthquake (May 3, 1996). The wrapped phase of these two interferograms are shown in figure 4© and figure 4(d). Different from the four previous interferograms shown in figure 3, these two interferograms have a fairly good correlation. The perpendicular baseline for the Interferogram using scenes of April 4, 1996 and April 5, 1996 is 66 m, and the perpendicular baseline for the interferogram using scenes of May 9, 1996 and May 10, 1996 is 143 m. These short baselines are likely to contribute to the high correlation in the interferometric phase.
4. Discussion
Using four SAR scenes from the ERS 1 and ERS 2 satellites, we produce four interferograms to image the surface deformation associated with Duvall earthquake. All the resultant phase of the four interferograms, however, show little correlation at least in the eipicenter location of the event. There are several possible reasons that might account for the decorrelation in the interferometric phase.
First, the noisy phase in the interferograms might due to temporal decorrelation. The time span for the four InSAR images is about one month and one week. Although not quite a long time period, the thick vegetation in this region might result in a low correlated phase in the InSAR images. The good phase correlation in the two InSAR results with time span of only one day probably does not suffer from the temporal decorrelation problem.
Second more likely reason accounting for the low correlation in phase is the baseline decorrelation. Notice that the baselines for the four InSAR images are 718 m, 575 m, 784 m and 641 m respectively. There is some uncertainty in the DEM and this uncertainty will propagate into the differential interferograms. Because the topography component of the phase is proportional to perpendicular baseline time the topography, a longer perpendicular baseline, given same topography model, would cause bigger error in the phase. The perpendicular baseline of the two high correlated InSAR images are shorter, 66 m and 143 m respectively. Therefore, we consider the relatively long perpendicular baseline is a very likely cause of the low correlation of the interferometric phase.
For now we have only consider the decorrelation from data limitation. The surface deformation itself, on the other hand, should also be quantitatively examined in order to better tell the deformation from undetectable signal. Many InSAR studies have focused on large earthquake, e.g., Landers earthquake (Massonnet et al., 1993, 1994; Price and Sandwell, 1998) and Hector Mine earthquake (Jocabs et al., 2002; Jonsson et al., 2002; Sandwell et al., 2002; Simons et al., 2002). There are also small earthquake (magnitude 5) studies using InSAR (Lohman and Simons, 2005). The surface deformation should be big enough to be seen from InSAR image.
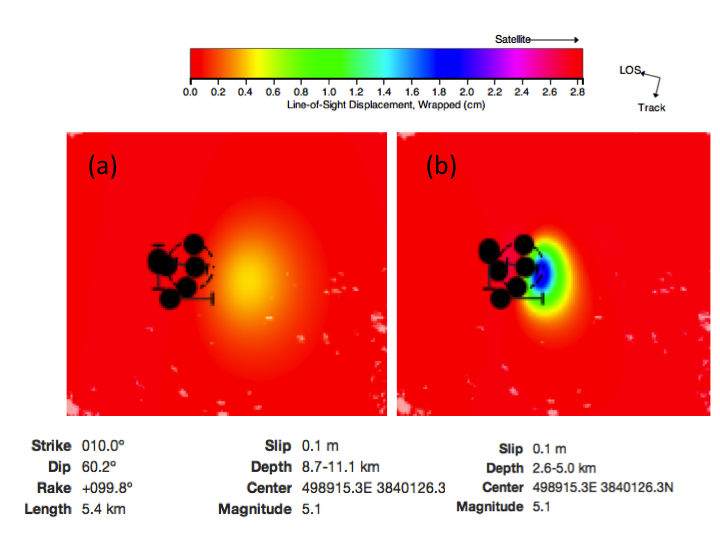
Figure 5. Forward modeling of the interferograms for Duvall earthquake at different depth. The strike, dip, rake, slip and length of the fault for the two modeling are set to be the same, but with different depth range. (a) The earthquake fault is put at a depth between 8.7-11.1 km. (b) The earthquake fault is put at a depth between 2.6-5.0 km.
We use forward modeling to quantitatively understand the amplitude of the deformation signal by InSAR for the Duvall Mw 5.1 earthquake. We adopt the faulting geometry based on focal mechanism solution and aftershock spatial distribution. We perform two separate forward modeling with same mechanism but different depth. For one modeling we put the source at a depth range of 8.7-11.1 km and for the other we put the source at a shallower range of 2.6-5.0 km. The modeling results are shown in figure 5. From the deeper event modeling we find that the signal seen by InSAR is with magnitude of 0.5 cm. This signal might not be clearly seen from an InSAR image, especially there exist other low correlated noise. In the simulation, the shallower event produce surface deformation that corresponding to a signal of 2 cm in InSAR image. A deformation signal with magnitude of 2 cm would probably show up on the InSAR image with appropriately short perpendicular baseline.
One thing should be mentioned is that the surface displacement vector for the Duvall earthquake maybe has a considerable component that is perpendicular to the looking direction of the satellite. This specific looking-displacement geometry could also limit us to achieve InSAR images with detectable signals. So exploration of more available ascending scenes (we use descending scenes in this study) with short perpendicular baseline would help to produce a high quality InSAR image.
5. Summary
The 1996 Duvall Mw 5.1 earthquake is the biggest one in Washington since 1966 and was followed by intense aftershock seismicity. We use four SAR scenes from ERS 1 and ERS 2 satellites to map the surface deformation of the earthquake. We produce four interferograms spanning the main shock, but they all show very low correlated interferometric phase. On one hand, the decorrelation might be from the long perpendicular baseline and/or temporal change of the scatter properties. On the other hand, using forward modeling we find that if the focal depth of Duval shock is 10 km or even deeper the corresponding signal on InSAR is 0.5 cm or smaller, which is might be at the edge of InSAR detectability. Given the distribution of the aftershocks, the Duvall earthquake might be a shallow event. Check of other available scenes with short perpendicular baseline would be key to give a better constraint on the earthquake location and a better understanding of the seismogenesis and earthquake hazard analysis in this area.
