Previous InSAR Studies
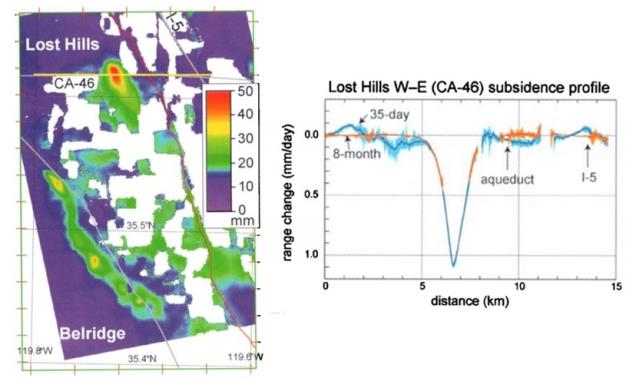
There has been limited previous published work on using InSAR to monitor oil wells. The most notable of these, however, is Fielding 1998 [5]. In this paper they use InSAR to map out surface deformation associated with a large drilling operation in Lost Hills, CA. As shown below in figure 3, they demonstrate that they can indeed see signal of this surface deformation from a satellite.
In the left panel the large red spot is the cumulative subsidence due to the drilling efforts over a 35 day period. We can see that the amount of deformation (~50mm) is quite large and is easily discernable. The panel at right shows a line cut of the subsidence rate through this well for both a 35 day and 8 month scene separation. Both cases show similar profiles for the well, which has a nice symmetric, exponential shape as one might expect for the subsidence into a vacated reservoir. The width of the peak is around 1-2 km, making it easily observable with the SAR resolution, which reflects on the deep and wide spread nature of the petroleum reservoir. Finally we can see that the peak subsidence rate of ~1.1 mm/day is well above the noise in the system, making this a robust measurement.
This and the works of ref 6 and 10, illustrate the fact that InSAR can indeed be used as a tool to monitor oil well activity. However they do not go into much detail, such as the scaling of pumping rates to deformation rates, or the time series of deformation to pumping activities such as hydraulic fracturing.
