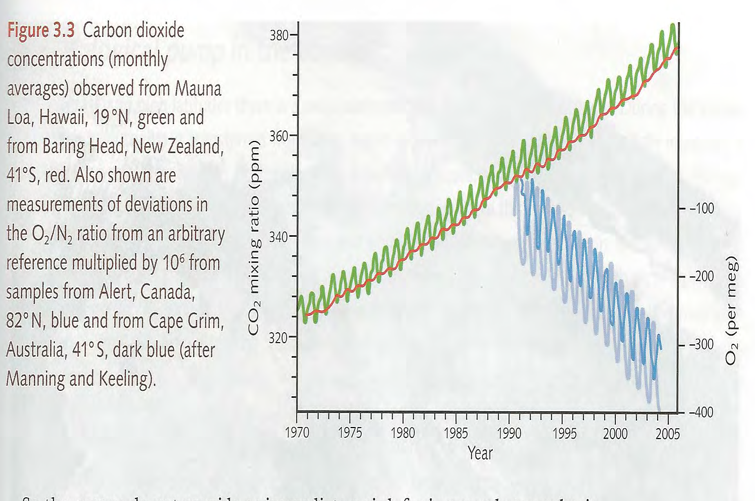
Fig. 3.3 CO
2
concentrations (monthly
averages) Mauna Loa & Baring Head,
New Zealand;
O
2
/N
2
ration
Houghton, 2009, p. 41.