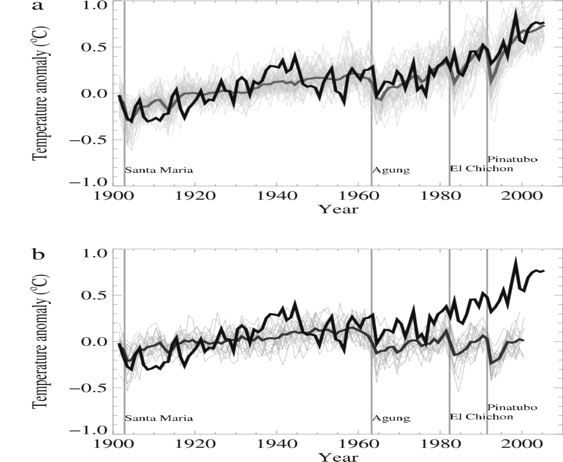
Figure 1. Comparison between global mean surface temperature anomalies (°C) from observations (thick black line) and AOGCM simulations forced with (a) both anthropogenic and natural forcing and (b) natural forcing only (thick gray line).
Source: IPCC (2007) Climate Change 2007 - The Physical Science Basis, Cambridge: Cambridge University Press. Figure 9.5 in Working Group I Contribution to the Fourth Assessment Report of the IPCC, Chapter 9: “Understanding and Attributing Climate Change,” p. 684.