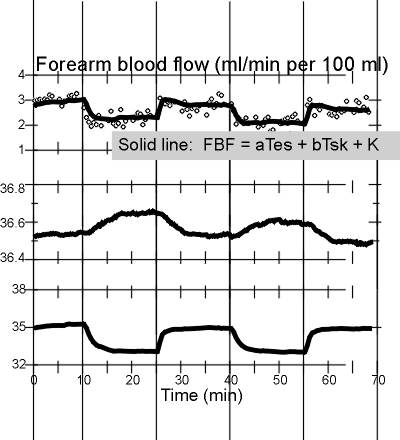
These are summary data from 8 subjects. At the bottom is the "square wave" pattern of skin temperature (Tsk), driven between 33 and 35C.
In the middle is the record of esophageal temperature (Tes). Each time Tsk was dropped, Tes rose slightly. The change occurred rapidly enough that much of it occurred while Tsk was still changing. The Tsk "square wave" was not ideal -- it took some time to drive Tsk between the 33 and 35C limits. This made it impossible to observe an unmistakeable Tc-related component in the blood flow response.
The dots in the top record are the FBF data. The smooth line passes through points computed from the equation based on linear regression analysis of the data points.
Links:
rationale in experimental design (with
links to methods pages)
return to index page