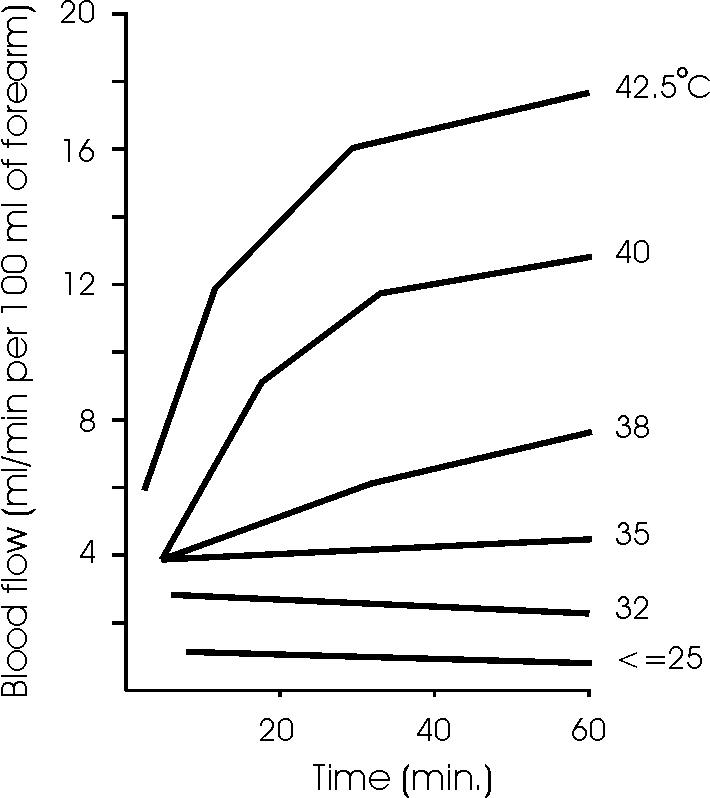
Figure 3.
Redrawn (freely) from the classical paper by Barcroft and
Edholm to illustrate the effect of local temperature on limb
blood flow, recorded by venous occlusion plethysmography. The
numbers on the right are the temperatures of water in the
plethysmograph in which the subject's arm was enclosed at time
zero. At temperatures above 35C, flow increased steadily, the
higher the temperature the higher the peak flow reached.